Employee Satisfaction Survey: Complete Guide with Questions, Templates, and Best Practices


-
1.What is an employee satisfaction survey?
-
2.Why measure employee satisfaction?
-
3.Employee satisfaction survey questions
-
4.Employee satisfaction survey template
-
5.Best practices for running an employee satisfaction survey
-
6.How to score and interpret your results
-
7.How to act on results
-
8.Employee satisfaction survey: Final thoughts
-
9.FAQs


You sent the survey. Seventy percent of your team responded, which felt like a win. Then the results came in, showing an average satisfaction score of 3.9 out of 5 across the board. Leadership nodded, declared things were going well, and filed the report.
Six months later, three of your best people resigned. All three had scored compensation and career growth below 3.0 on that same survey.
The problem was not the survey, but what happened after it.
An employee satisfaction survey measures how content employees are with specific aspects of their job: pay, workload, management, work environment, and career development. When designed well and followed up on, it is one of the highest-leverage tools an HR team has. When treated as a box-checking exercise, it actively erodes trust.
In this guide, I’ll cover everything you need to know:
- What an employee satisfaction survey is
- How it differs from other measurement tools
- 30+ questions organized by category
- A ready-to-use template
- How to score and interpret your results
- What to do once the data is in
| A note on pulse surveys and engagement surveys A satisfaction survey is broader and less frequent than a pulse survey, and more specific than an engagement survey. If you are looking for a short weekly or biweekly check-in format, see our pulse survey questions guide. If you want to measure emotional investment in the company rather than job conditions, see our employee engagement survey questions. |
What is an employee satisfaction survey?
An employee satisfaction survey is a structured questionnaire that measures how content employees are with specific aspects of their working conditions. Those aspects typically include compensation, workload, management quality, opportunities for growth, work environment, and work-life balance.
The output is a set of scores that tells HR and leadership which areas are working, which need attention, and where the biggest retention risks are hiding.
A few clarifications that matter before you design yours:
Satisfaction survey vs engagement survey
These two are often used interchangeably. They measure different things.
| Employee Satisfaction Survey | Employee Engagement Survey |
| Measures how employees feel about specific job conditions | Measures emotional investment and commitment to the company |
| Focus areas: pay, benefits, workload, manager, environment | Focus areas: purpose, belonging, growth, organizational culture |
| Frequency: once or twice a year | Frequency: quarterly or monthly via pulse format |
| Length: 20 to 30 questions across categories | Length: 5 to 15 questions |
| Output: actionable scores per category | Output: overall engagement score and drivers |
Satisfaction survey vs pulse survey
A pulse survey is a short, frequent check-in, typically 3 to 5 questions, sent weekly or biweekly. It tracks trends in real time. A satisfaction survey goes deeper, fewer times a year, and covers a broader set of job dimensions.
Both are useful. They serve different purposes and work well together.
Happiness survey vs satisfaction survey
Happiness at work is a broader, more subjective sense of well-being. It is influenced by factors beyond the job itself: personal life, relationships, and general mood.
Satisfaction is anchored to specific, measurable job conditions. You can score satisfaction by category. Happiness is harder to pin down and fluctuates more day-to-day.
A satisfaction survey is the more actionable of the two for HR purposes because the results point directly to areas the organization can change. For a fuller picture of employee happiness and what drives it, see our guide to happiness at work.
Why measure employee satisfaction?
The short answer: because what you cannot measure, you cannot improve.
The slightly longer answer:
- Retention signal. Satisfaction scores, particularly in compensation, management, and career growth, are leading indicators of turnover. Employees who are about to leave almost always show low scores in at least one of these categories months before they hand in their notice.
- Productivity correlation. Happy employees are 13% more productive than their unhappy counterparts. Satisfaction is not identical to happiness, but the two are closely linked.
- Trust signal. Running a survey and acting on the results is one of the most visible ways an organization can show employees that their voices matter. Skipping the follow-up has the opposite effect.
- Data over assumption. Leadership teams tend to overestimate how satisfied their workforce is. A survey replaces assumptions with actual data, often revealing problem areas that were invisible from the top.
Employee satisfaction survey questions
The questions below are organized into eight categories. Each category covers a distinct dimension of the job experience. Use all of them for a full baseline survey, or select the categories most relevant to what your organization is currently dealing with.
For each closed question, use a 1 to 5 Likert scale: 1 = strongly disagree, 5 = strongly agree. Include two or three open-ended questions at the end.
Category 1: Job role and workload
Workload imbalance is one of the fastest routes to burnout and disengagement. These questions measure whether employees have the conditions they need to do their job well.
- My workload is manageable and realistic.
- I have the resources and tools I need to do my job well.
- My responsibilities are clearly defined.
- I rarely need to work outside regular hours to complete my tasks.
- The distribution of work across my team feels fair.
Category 2: Compensation and benefits
Pay is not always the top reason people leave, but the perception of fairness around pay almost always is. These questions surface that perception.
- I feel fairly compensated for my contributions.
- Our benefits package meets my personal needs.
- I understand how pay decisions are made at this company.
- I am satisfied with the non-monetary benefits available to me, such as flexibility, paid time off, and wellness support.
Category 3: Management and leadership
According to McKinsey, uncaring or uninspiring managers are among the top three reasons employees leave. These questions cover both direct management and senior leadership.
- My manager gives me useful, regular feedback.
- I feel comfortable bringing concerns to my manager.
- Senior leadership communicates the company’s direction clearly.
- My manager actively supports my professional development.
- I trust that leadership makes decisions that consider employee interests.
Category 4: Career growth and development
Employees who cannot see a future at the company will look for one elsewhere. These questions assess whether the organization provides the conditions for people to grow.
- I have real opportunities to grow within this company.
- I receive the training I need to do my job well.
- My career goals are supported by my manager.
- I can see a clear path to advance my career here.
Category 5: Work environment and culture
Google’s Project Aristotle identified psychological safety as the single strongest predictor of high-performing teams. Culture is not soft. It determines whether people stay, contribute, and speak up.
- I feel psychologically safe to share my opinion at work.
- Team collaboration at this company works well.
- I feel a sense of belonging here.
- The company’s values align with my own.
- I feel included and respected regardless of my background.
Category 6: Work-life balance
Remote and hybrid workers consistently report higher satisfaction in this category than full-time office workers. These questions help you understand whether your current setup is working.
- I can disconnect from work outside regular working hours.
- My workload allows me to maintain a healthy personal life.
- I feel supported when I need flexible working arrangements.
- I have enough paid time off to rest and recharge.
Category 7: Recognition and belonging
Gallup data shows that only one in three employees in the US strongly agrees they received meaningful recognition in the past week. Recognition is a high-impact, low-cost lever.
- My contributions are recognized in a meaningful way.
- I feel valued as an employee here.
- Recognition at this company is fair and consistent.
- I would recommend this company as a great place to work. (This is your eNPS question.)
Category 8: Open-ended questions
Close the survey with two or three open-ended questions. Employees are warmed up by this point, and the qualitative responses often surface issues that the closed questions missed.
- What is the one thing the company could change to improve your day-to-day satisfaction?
- What do you value most about working here?
- Is there anything you would like leadership to know that this survey did not cover?
| HeartCount tipHeartCount’s custom survey feature lets you build category-specific question sets and combine them into a single survey, so you can adapt this list to your company’s context without starting from scratch. Each category becomes a standalone block you can swap in or out depending on what you are measuring. |
Employee satisfaction survey template
Copy the template below and adapt the wording of the question to match your company’s tone. The instruction block at the top is what employees see when they open the survey.
Pre-survey instruction block
We want to hear from you.
This survey asks about your experience working here: your workload, your manager, your career, and your overall satisfaction. Your answers will help us identify what is working well and where we need to do better.
Your responses are anonymous. Results are only shared in aggregate, and no individual responses are ever visible to managers or HR. Groups of fewer than five people are not reported separately.
The survey takes about 8 minutes. Please complete it by [DATE].
We will share a summary of the results and our planned actions within [X weeks] of the survey closing.
Survey questions
Rate each statement from 1 to 5: 1 = Strongly disagree, 2 = Disagree, 3 = Neutral, 4 = Agree, 5 = Strongly agree.
Job role and workload
- My workload is manageable and realistic.
- I have the resources and tools I need to do my job well.
- My responsibilities are clearly defined.
- I rarely need to work outside regular hours to complete my tasks.
- The distribution of work across my team feels fair.
Compensation and benefits
- I feel fairly compensated for my contributions.
- Our benefits package meets my personal needs.
- I understand how pay decisions are made at this company.
- I am satisfied with the non-monetary benefits available to me.
Management and leadership
- My manager gives me useful, regular feedback.
- I feel comfortable bringing concerns to my manager.
- Senior leadership communicates the company’s direction clearly.
- My manager actively supports my professional development.
- I trust that leadership makes decisions that consider employee interests.
Career growth and development
- I have real opportunities to grow within this company.
- I receive the training I need to do my job well.
- My career goals are supported by my manager.
- I can see a clear path to advance my career here.
Work environment and culture
- I feel psychologically safe to share my opinion at work.
- Team collaboration at this company works well.
- I feel a sense of belonging here.
- The company’s values align with my own.
- I feel included and respected regardless of my background.
Work-life balance
- I can disconnect from work outside regular working hours.
- My workload allows me to maintain a healthy personal life.
- I feel supported when I need flexible working arrangements.
- I have enough paid time off to rest and recharge.
Recognition and belonging
- My contributions are recognized in a meaningful way.
- I feel valued as an employee here.
- Recognition at this company is fair and consistent.
- I would recommend this company as a great place to work.
Open-ended questions
- What is the one thing the company could change to improve your day-to-day satisfaction?
- What do you value most about working here?
- Is there anything you would like leadership to know that this survey did not cover?
Pre-survey employee communication template
Send this message to your team two to three days before the survey launches. The more context employees have, the higher the completion rate and the more honest the responses.
Subject / Slack message: Your input matters. We’re listening.
Hi team,
We are running our [quarterly / biannual] employee satisfaction survey from [START DATE] to [END DATE]. It covers workload, compensation, career growth, management, culture, and work-life balance.
A few things to know:
Your responses are anonymous. Individual answers are never visible to managers or HR. Results are only shared in aggregate for groups of five or more.
We will share results and planned actions with the whole company within [X weeks] of closing the survey.
The survey takes about 8 minutes. [SURVEY LINK]
Questions? Reach out to [HR contact / email].
Thank you, [Name]
| With HeartCount, you can schedule this pre-survey message to go out automatically when your survey launches, and set automated reminders for employees who have not yet responded. Build your question set using HeartCount’s custom survey builder and load the template above directly. |
Best practices for running an employee satisfaction survey
A well-run survey gets honest, complete responses. A poorly run one gets low participation, socially desirable answers, and unreliable results. These five practices make the difference.
1. Set clear objectives before you write a single question
Decide what you want to learn before you design the survey.
If you are running a baseline measurement for the first time, use all eight categories. If you are investigating a specific area, such as declining scores on a particular team or signs of burnout in a department, focus your question set on that area.
A focused survey with 15 well-chosen questions will outperform a generic 40-question survey every time.
2. Be specific about how anonymity works
Telling employees the survey is anonymous is not enough. Explain the mechanics: who has access to raw data, what the minimum group size is before results are reported, and whether your survey tool is third-party or internal.
Employees in small teams are often nervous that their responses can be identified, even when anonymity is promised. Remove the ambiguity, and you will get more honest answers.
3. Avoid survey fatigue
A satisfaction survey runs once or twice a year. That cadence keeps it meaningful and prevents response quality from degrading.
If you want more frequent check-ins, use pulse surveys between cycles rather than increasing the frequency of the full survey. Sending a 30-question survey every other month is a reliable way to train your team to ignore surveys altogether.
4. Pick the right timing
Avoid running a satisfaction survey during high-stress periods: end-of-quarter pushes, directly after layoffs, during a product launch crunch, or in the first few weeks after someone joins. Responses will reflect current stress rather than underlying satisfaction levels, skewing your data.
A good default schedule: once in Q1 or Q2, and once in Q3. This gives you two data points per year and time to act between cycles.
5. Plan the follow-up before you launch
The single most common reason employees stop responding to surveys is that nothing changed after the last one.
Plan your communication and action process before the survey goes out, not after you get the results. Decide in advance who owns which categories, what the timeline for sharing results looks like, and how you will handle low scores in sensitive areas.
Employees will notice when the follow-through is real.

How to score and interpret your results
Once your survey closes, calculate the average score for each category on a 1-to-5 scale. Do not start with the overall average. Start with the category-level breakdown.
Score benchmarks by category
| Average score (1 to 5) | What it means | Recommended action |
| 4.5 to 5.0 | Excellent. Employees are genuinely satisfied in this area. | Maintain. Do not ignore these categories in future surveys because satisfaction can erode quickly without continued attention. |
| 3.5 to 4.4 | Good, with room for improvement. Most organizations land here. | Identify the subcategories or individual questions scoring below 4.0 and address them specifically. |
| 2.5 to 3.4 | Warning zone. This category is a retention risk. | Escalate to leadership and address within 30 days. Inform employees that you have reviewed the score and are taking action. |
| 1.0 to 2.4 | Critical. Immediate attention required. | Escalate immediately. Scores at this level strongly correlate with high turnover in the following 3 to 6 months. |
Segment before you aggregate
A company-wide average of 3.8 can mask a specific team at 2.4 and another at 4.9.
Before you report results or decide on actions, filter your data by department, manager, seniority level, and tenure.
Aggregated scores are useful for trend tracking. Segmented scores are where the real issues show up.
Track trend over time
An absolute score of 3.2 in work-life balance tells you something. A score of 3.2 that was 4.1 six months ago tells you a lot more.
The direction of movement is often more informative than the current number. Build your survey cadence around the goal of tracking change over time, not just taking a snapshot.
Use an impact-effort matrix to prioritize
After scoring, you will likely have several categories that need improvement. Not all of them can be addressed at once.
Map each issue on two dimensions: how much impact would fixing it have on satisfaction and retention, and how difficult it is to fix.
- High-impact and low-effort items go first.
- High-impact and high-effort items need a longer-term plan.
- Low-impact items get deprioritized.
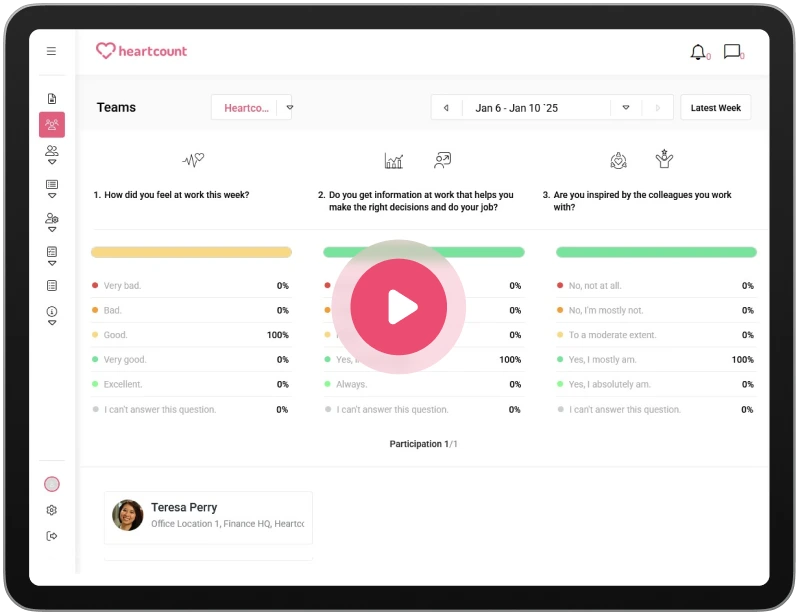
| HeartCount‘s survey dashboard automatically segments results by team and flags categories below your set threshold, so HR can see where the problems are without manually cross-tabulating spreadsheets. The dashboard tracks score trends over time and surfaces the categories that have experienced the largest drops since the previous survey. |
How to act on results
Scores without action are worse than no survey at all. Employees who give honest feedback and see nothing change feel more ignored than they would have if you had never asked. This is a documented phenomenon in employee research, and it has a name: survey fatigue from inaction.
Here is a simple process that works:
Share results with everyone
Share the results summary with all employees, not just HR and leadership. You do not need to share every data point. Share the headline findings: what scored well, what scored low, and what you heard in the open-ended responses.
Be direct. Employees can tell when communication is sanitized.
Timeline: Share results within two weeks of the survey closing. The longer you wait, the less connected employees feel to the process.
Pick two or three actions and commit
Do not try to fix everything at once. Choose the two or three categories with the lowest scores or the highest retention risk, assign an owner to each, and set a 30, 60, or 90-day deadline. Announce these commitments publicly, so employees know you are tracking them.
For actions that connect directly to retention risk, see our guide to employee retention strategies for a set of proven frameworks.
Close the loop with a follow-up
At the next survey cycle, report back on what you committed to and what changed. Show the score comparison from the previous cycle. This is what builds long-term trust in the survey process and keeps participation rates high over time.
| HeartCount’s semiannual reports summarize score trends for every category across the full survey cycle. You can pull a comparison view showing the delta between the current and previous surveys and share it directly with leadership or your team. |
Employee satisfaction survey: Final thoughts
Running the survey is the easy part. Acting on what it tells you is where most organizations stall. The questions, template, and scoring guide in this article give you everything you need to build a process that produces reliable data. The rest depends on what you do with it.
HeartCount’s custom surveys let you run a structured satisfaction survey, segment results by team, track scores over time, and flag the categories most at risk, all from a single dashboard.
If you want to see what that looks like in practice, start with the HeartCount journey today!
FAQs
How often should you run an employee satisfaction survey?
Once or twice a year is the standard cadence for a full satisfaction survey. Running it more frequently than that tends to reduce response quality. For more regular check-ins between cycles, use pulse surveys, which are shorter, faster, and designed for higher frequency.
What is a good employee satisfaction score?
On a 1 to 5 Likert scale, scores above 4.0 are generally considered strong. Scores below 3.0 in any category warrant immediate attention. The more important number is the trend: a score of 3.2 that is improving is a better signal than a score of 4.0 that has dropped from 4.6. See the scoring table in the previous section for a full breakdown.
How do you ensure anonymity in employee surveys?
Use a third-party survey tool rather than an internal form. Set a minimum threshold for reporting group results, typically five or more respondents, so no individual response is identifiable. Communicate clearly to employees exactly who has access to the data and what the threshold is. The more specific you are, the more trust you build.
What is the difference between a satisfaction survey and an engagement survey?
A satisfaction survey measures how employees feel about specific job conditions: pay, workload, management, and career opportunities. An engagement survey measures how emotionally invested employees are in their work and the organization.
What should I do if survey completion rates are low?
Completion rates below 60% usually signal one of two things: employees do not trust that responses are truly anonymous, or they do not believe anything will change based on their input.
The pre-survey communication template earlier in this guide addresses the first issue. Demonstrating visible follow-through from your previous survey addresses the second.
If you are running a first-ever survey, be explicit about your commitment to sharing results and taking action.