Employee Engagement Statistics: What the Data Actually Tells Us About Motivation, Autonomy, and Burnout


Every year, companies run engagement surveys. Most produce a score, a slide deck, and a follow-up meeting that changes very little.
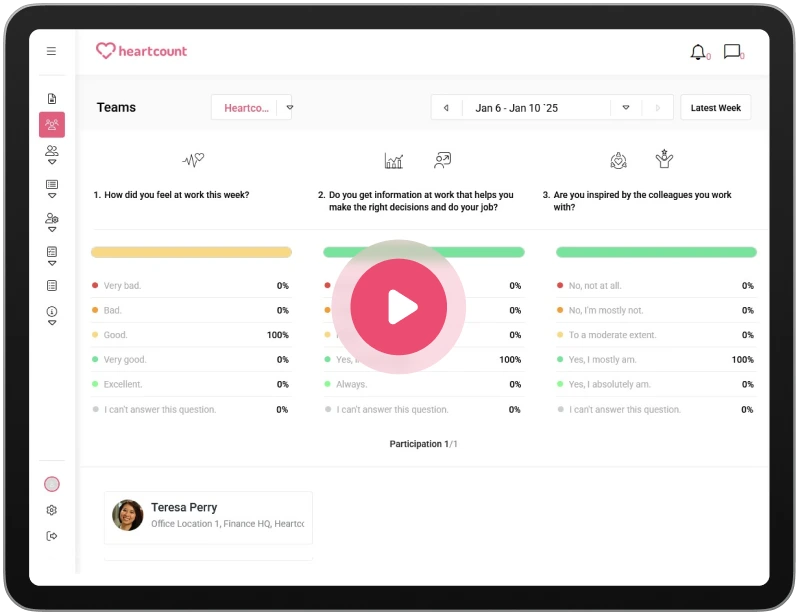
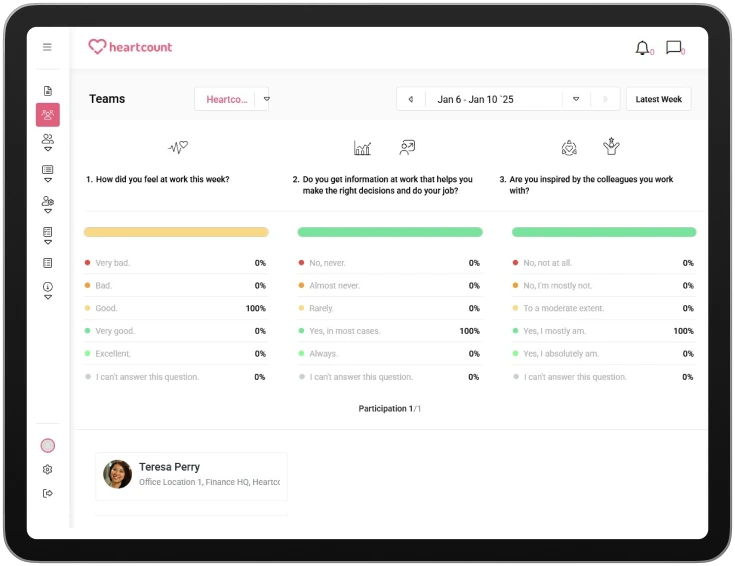
At HeartCount, we do things differently. Instead of annual snapshots, we collect weekly pulse data continuously, across organizations of different sizes, industries, and regions. When we talk about employee engagement statistics, we’re not describing a single moment, but a pattern.
We analyzed responses from tens of thousands of employees across three dimensions that sit at the core of any healthy workplace: motivation, autonomy, and emotional exhaustion. Here’s what the data actually tells us, and what it means for HR leaders and managers trying to build workplaces that last.

Employees Are More Resilient Than the Headlines Suggest
Before diving into each dimension, one thing stands out immediately: the overall picture is more positive than most workplace narratives would lead you to expect.
Across all three dimensions, the majority of employees are in a healthy place. But the data also reveals a consistent and important gap, one that shows up across motivation, autonomy, and exhaustion alike. And that gap is worth paying close attention to.
Employee Motivation Statistics
Average score: 3.87 / 5
Three out of four employees (75.77%) report being motivated at work. Only 5.43% say they are not. On the surface, that sounds like good news. And it is.
But look closer, and a more nuanced story emerges.
The strongest motivation scores come from within. “I have a personal motivation to do my best at work” scored 4.15, the highest in this dimension. “Most days, I have the energy and motivation to do my job,” followed closely at 4.10.
Employees are showing up with genuine drive. That internal engine is running.
What’s lagging behind is the organizational side of motivation. “While working, I feel empowered” scored just 3.78, the lowest in the dimension. “I usually look forward to going to work,” came in at 3.90. “Colleagues provide me with information about how effective my work performance is,” scored 3.91, pointing to a feedback culture that still has room to grow.
What this tells us: Employees are motivated despite their environment, not because of it. Personal drive is carrying the weight that empowerment and feedback culture should be sharing. That’s sustainable in the short term, but it places an invisible burden on employees that compounds over time.
Employee Autonomy Statistics
Average score: 3.96 / 5
Autonomy is the strongest of the three dimensions. 80.07% of employees report having autonomy in their work. Only 4.55% say they don’t. These are encouraging numbers.
And when you look at which specific questions scored highest, the pattern is revealing: employees excel at execution.
“I complete most of my tasks on time” and “I meet my goals while making very few mistakes” both scored 4.26, which is the highest score in the entire dataset. “Most days, I arrive at work ready and well-prepared” scored 4.20. “Other employees treat me with respect” also hit 4.20.
Employees are reliable, disciplined, and respectful of each other. The operational foundation is strong.
But autonomy in the strategic sense tells a different story. “This role has strong potential for future advancement” scored just 3.59, the lowest score in the autonomy dimension and one of the lowest across all dimensions. “When performing tasks, I have as much freedom as I would like” came in at 3.92.
What this tells us: Employees have autonomy over how they do their work, but not over where it’s taking them. They execute well within defined lanes, but those lanes don’t always feel like they lead somewhere. Career advancement clarity is the single biggest gap in this dimension, and it directly affects retention.

Employee Burnout Statistics
Average score: 3.59 / 5
Emotional exhaustion is the dimension that deserves the most attention, not because the numbers are alarming, but because of what’s hiding in them.
63.93% of employees report not being emotionally exhausted. That’s a solid majority. But 12.38% say they are, and 19.49% are in the neutral zone, which in the context of burnout is rarely a comfortable place to be. Combined, that means more than 30% of employees are either burned out or on the edge.
The protective factors are real. “I had misunderstandings with management lately” scored 4.25 (higher score = fewer misunderstandings, which is a good sign). “My direct supervisor ensures that all relevant work information is communicated clearly and promptly” scored 4.21. Clear communication from managers is functioning as a genuine buffer against exhaustion.
But two areas stand out as risk signals. “In terms of career advancement, within this company, there is an invisible barrier,” scored 3.28, which is the lowest score across the entire dataset. “In the last few months, there have been situations that I have negative feelings about,” scored 3.37. These are early warning signs of disengagement and eventual turnover.
The score for “The company genuinely cares about employees’ mental health” came in at 3.61, and “Thinking about work outside of working hours causes me significant stress” sits at 3.59. Both are squarely in the middle, which is not crisis territory, but not comfortable either.
What this tells us: Burnout in 2025 is not primarily caused by overwork. It’s more about blocked paths and accumulated negative experiences. Employees who don’t see a way forward and have been carrying unresolved frustrations are the ones most at risk.
The good news: strong management communication is already acting as a protective factor. The opportunity is to extend that protection to career clarity and the emotional weight employees carry day to day.
The Pattern Across All Three Dimensions of Employee Engagement Statistics
When you look at motivation, autonomy, and emotional exhaustion together, one theme runs through all three: the gap between operational strength and strategic experience.
Employees complete tasks on time. They show up prepared and motivated at a personal level. They respect their colleagues. These are the foundations of a functioning workplace, and most organizations have them.
What’s consistently weaker is the experience of growth, empowerment, and forward momentum. Career advancement scores poorly in both autonomy and emotional exhaustion. Empowerment lags behind personal motivation. Feedback culture is underdeveloped relative to the individual drive that employees bring on their own.
This matters because personal motivation and operational reliability are finite resources. They sustain performance over months. But without organizational fuel: career clarity, meaningful feedback, and genuine empowerment, they slowly deplete.
The data suggests that most companies are drawing on their employees’ intrinsic resources without replenishing them. That’s not a crisis yet. But it is a trajectory.
What HR Leaders Should Take Away
Three things stand out from the 2025 data as priorities for organizations that want to stay ahead of disengagement:
- Don’t mistake personal motivation for organizational health. A motivated workforce is an asset, but when motivation is driven almost entirely by individuals rather than by the environment in which they work, it’s also a vulnerability. The question isn’t “are our people motivated?” but “are we making it easier or harder for them to stay that way?”
- Career advancement clarity is a retention issue. The lowest scores across the entire dataset relate to future advancement and invisible career barriers. Employees who can’t see a path forward become less engaged and start looking for the exit. Regular career conversations and transparent growth paths are a retention mechanism.
- The neutral zone in burnout is where the real risk lives. Most burnout conversations focus on the employees who are clearly exhausted. But nearly 20% of employees sit in the neutral zone on emotional exhaustion — not burned out, but not thriving. This group is where early intervention has the highest return. Catching signals before they become symptoms is exactly what continuous, weekly data collection makes possible.

A Note on the Data
These employee engagement statistics are drawn from HeartCount’s anonymized, aggregated pulse survey data collected throughout 2025, across organizations spanning multiple industries and company sizes.
All data reflect responses on a 1–5 scale, with higher scores indicating more positive outcomes (except for inverse items, where higher scores indicate less exhaustion, fewer misunderstandings, etc.).
HeartCount measures employee engagement through weekly pulse surveys built on 140 scientifically validated questions, developed in collaboration with organizational psychologists and psychometricians.
The three dimensions we analyzed, motivation, autonomy, and emotional exhaustion, are part of a broader engagement model that includes relationships with colleagues, relationships with management, personal development, productivity, and job satisfaction.
Want to see what this data looks like inside your organization? Get started with HeartCount today.