15 HR Metrics That Actually Matter (And How to Track Them)


In a world of dashboards, data, and deadlines, it’s easy to lose sight of which HR metrics actually move the needle. But tracking the right ones does more than satisfy reporting cycles. It drives culture, performance, and retention from the inside out.
The challenge is knowing what to measure and how to make it useful. From burnout risk to hiring speed, HR teams are expected to deliver insights that shape real decisions. And not just once a year, continuously.
This guide breaks down 15 of the most useful metrics for evaluating employee performance grouped by business focus. Whether you’re refining your HR metrics dashboard, setting team KPIs, or zeroing in on what the C-suite wants to see, this is your starting point.
At HeartCount, we help teams make better people decisions through real-time feedback, weekly sentiment data, and action-ready insights that fit into everyday workflows.

-
1.What Are HR Metrics?
-
2.Why HR Metrics Matter More Than Ever in 2025
-
3.HR Metrics Examples: 15 KPIs Grouped by Business Focus
-
4.How to Build an HR Metrics Dashboard That Drives Action
-
5.How High‑Performing Teams Use HR Metrics to Improve
-
6.Best Practices for Presenting HR Metrics to Stakeholders
-
7.FAQs About HR Metrics


In a world of dashboards, data, and deadlines, it’s easy to lose sight of which HR metrics actually move the needle. But tracking the right ones does more than satisfy reporting cycles. It drives culture, performance, and retention from the inside out.
The challenge is knowing what to measure and how to make it useful. From burnout risk to hiring speed, HR teams are expected to deliver insights that shape real decisions. And not just once a year, continuously.
This guide breaks down 15 of the most useful metrics for evaluating employee performance grouped by business focus. Whether you’re refining your HR metrics dashboard, setting team KPIs, or zeroing in on what the C-suite wants to see, this is your starting point.
At HeartCount, we help teams make better people decisions through real-time feedback, weekly sentiment data, and action-ready insights that fit into everyday workflows.
What Are HR Metrics?
HR metrics are the quantifiable measures that show how your people systems are performing across hiring, engagement, performance, wellbeing, and retention. They turn everyday activity into signals you can trend, benchmark, and act on. Leading orgs now treat HR metrics and analytics as a discipline: standard definitions, clean data pipelines, and review cadences that line up with real decisions. Think “smarter, higher-frequency KPIs” rather than static, backward-looking reports, a shift highlighted in MIT Sloan Management Review on enhancing KPIs with AI.
In HeartCount, this looks practical: standardised definitions for each metric, weekly pulse inputs to keep sentiment fresh, and a live HR metrics dashboard that flags risks with thresholds and owner alerts. Because the platform combines pulse data, recognition activity, and manager follow-through, your numbers stay decision-ready instead of becoming a monthly PDF that no one reads.
HR Metrics vs. HR KPIs: What’s the Difference?
Use the table below to keep terminology tight and your reporting useful.
| Aspect | HR metrics | HR KPIs |
| Purpose | Descriptive measures of people activity or outcomes (what’s happening). | Priority measures tied to business goals and targets (what must improve). |
| Scope | Broad set; diagnostic and exploratory. | Narrow subset; board- and ELT-relevant. |
| Time horizon | Often historical or current-state. | Mix of leading and lagging with thresholds and timelines. |
| Ownership | Functional (TA, L&D, HR Ops, People Analytics). | Named owner with explicit review cadence (e.g., monthly ELT). |
| Governance | Standard definitions and consistent data capture. | KPI governance: targets, alert rules, decision rights. |
| Example | “First-year attrition rate” or “pulse survey participation.” | “Reduce first-year attrition to <12% by Q4; escalate if any cohort >15% for two consecutive months; HRBP + TA accountable.” |
Rule of thumb: a metric becomes a KPI when you attach (1) a concrete target, (2) an accountable owner, (3) a review cadence, and (4) an action trigger. That governance is what turns an HR metrics dashboard into a management tool instead of a monthly PDF.
Why Modern HR Teams Can’t Afford to Ignore Metrics
To meet today’s business demands, HR needs more than intuition and annual reviews. Metrics give structure to what matters, helping teams spot problems early, measure progress, and tie people strategy to business outcomes. The most effective HR leaders treat metrics as essential tools for navigating change, not just reporting on it.
- Strategy moves faster than annual reporting. Leaders need real-time, human-centered measures they can steer with, not end-of-quarter recaps.
- AI raises the evidence bar. As automation reshapes work, leadership expects decision-grade indicators of capacity, skills, and performance shifts
- Skills are changing, quickly. With core skills shifting this decade, HR metrics to track reskilling, mobility, and proficiency are essential
- Make metrics decision-grade. Moving from counts to governed KPIs, with targets, alert rules, and ownership, makes your HR metrics and analytics actionable for execs and managers alike.
Mini example (turning a metric into a KPI)
- Metric: First-year attrition rate.
- KPI: “Reduce first-year attrition to <12% by Q4; trigger investigation if any cohort exceeds 15% for two consecutive months; reviewed monthly in ELT; HRBP + Talent Acquisition accountable.”
This shift from passive tracking to active performance management is what separates lagging teams from forward-looking ones. Metrics only matter when they’re trusted, visible, and actionable, and that starts with how you define them.
Why HR Metrics Matter More Than Ever in 2025
HR metrics have shifted from nice-to-have indicators to core decision-making inputs. In 2025, workforce expectations are rising, leadership is demanding real-time insight, and HR teams are expected to prove impact, not just track activity.
Companies that commit to people analytics are seeing the difference. According to McKinsey, organisations that use people data to inform talent decisions are over three times more likely to outperform peers on productivity and profitability. And the most effective ones don’t just look back. They track live signals and adjust in the moment.
Real-Time People Data: The New Standard
Executive teams now operate on faster cycles, and they expect HR to match that pace with metrics that are timely, segmented, and tied to business outcomes.
Static dashboards don’t meet that need. Metrics like burnout risk, pulse survey participation, and manager responsiveness only add value when they are updated regularly and surfaced with context.
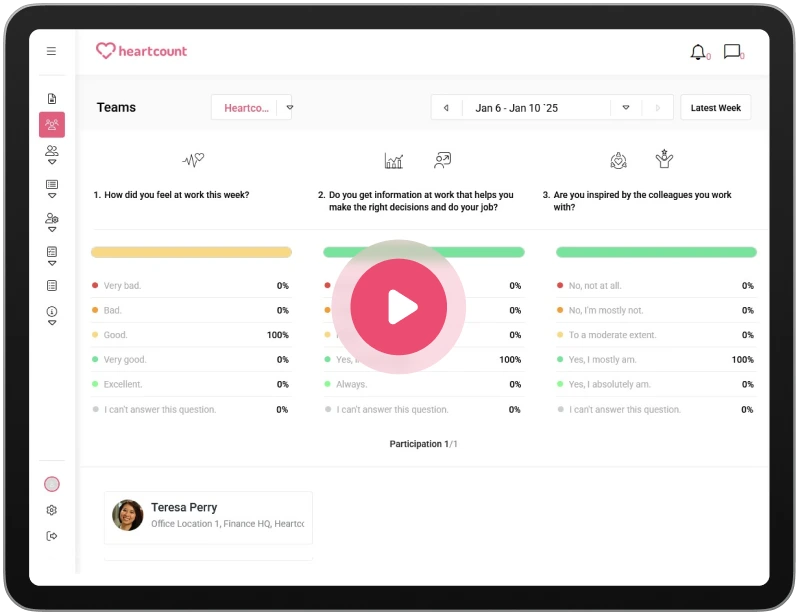
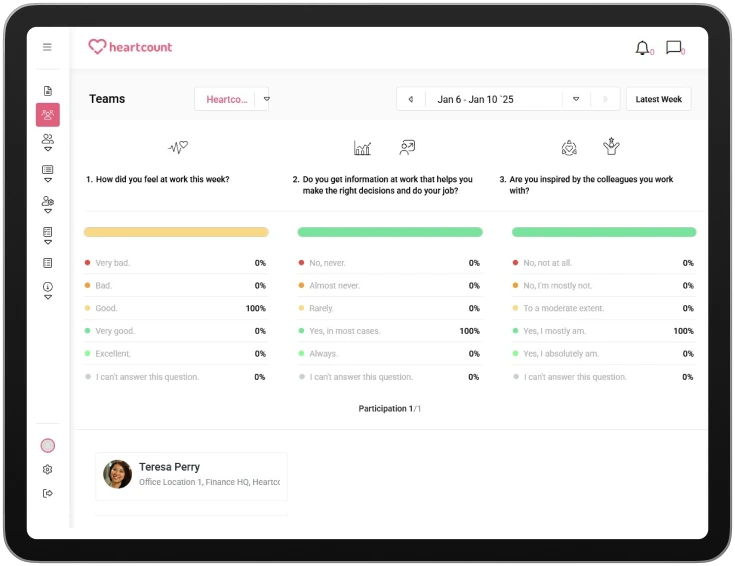
That’s why we built our data-driven insights dashboard. It helps HR teams spot trends, compare cohorts, and detect risk patterns early, so you can act before issues spiral. Instead of scanning disconnected tools, your data flows into one place, where signals are easier to interpret and share.
Beyond Annual Surveys: The Case for Continuous Feedback
In today’s hybrid, fast-changing workplaces, delayed feedback creates blind spots. That’s why we encourage teams to shift from static annual surveys to consistent, lightweight check-ins.
If you use HeartCount, you’ll have access to automated employee pulse check surveys which make it easy for teams to collect and act on feedback weekly, without causing survey fatigue. By keeping check-ins simple and regular, you build a steady stream of insight into how employees are feeling, so you can respond while the signals are still fresh.
This isn’t about volume. It’s about building a loop:
- Measure pulse participation and trends across teams
- Track how managers follow up and close the loop
- Monitor recognition frequency and team-level sentiment shifts
Together, these give you leading indicators of trust, culture health, and emerging friction, especially in dispersed or hybrid environments.
What Your C-Suite Actually Cares About
While HR might track dozens of indicators, executives care about a focused few that are tied to outcomes:
- First-year attrition rates and where they cluster
- Internal mobility across departments or roles
- Time to hire and cost per hire
- Sentiment trends in high-priority business units
These metrics serve as early signals of growth, stability, and leadership effectiveness. But the value doesn’t come from numbers alone. It comes from interpreting what they mean and what’s changing behind the scenes.
That’s where a real-time dashboard makes a difference. When your metrics are segmented by team or manager, paired with comments, and tracked over time, leaders can move from “What’s happening?” to “What should we do about it?”
COLLECT
HR Metrics Examples: 15 KPIs Grouped by Business Focus
There’s no one-size-fits-all when it comes to HR metrics, but grouping them by business objective makes it easier to track what matters most. Whether you’re trying to improve hiring efficiency, boost engagement, or reduce burnout, each metric plays a role in connecting people data to real outcomes.
This section breaks down 15 essential HR KPIs, organised into five categories that reflect the employee journey: recruitment, engagement, performance, retention, and culture. These are the HR metrics to track if you want to build a dashboard that drives action, not just reporting.
Recruitment & Onboarding
Getting hiring right is more than filling roles quickly, it’s about finding the right people, proving ROI, and building a consistent experience from first touch to first check-in. These HR metrics to track help you evaluate both efficiency and quality in your talent acquisition pipeline.
1. Time to Hire
Measures the number of days between when a job is opened and when a candidate accepts the offer. It reflects how efficiently your hiring process is moving, and where bottlenecks are hiding.
- Why it matters: Long hiring cycles can signal internal delays, unclear role definitions, or sourcing gaps. Tracking it by department or role type helps pinpoint the issue.
- Cadence: Monthly
- Good to know: Time to hire is often confused with time to fill, which measures the total days from job requisition to offer acceptance. The distinction matters when diagnosing whether delays are happening before or after the role goes live.
2. Cost per Hire
Total hiring spend divided by the number of hires in a given period. This includes job ads, recruiter fees, onboarding tools, internal time costs, and more.
- Why it matters: This is a key HR KPI for budgeting and ROI. A high cost isn’t necessarily bad, but it should reflect quality and retention.
- Cadence: Quarterly
- How HeartCount helps: If your hiring process includes onboarding surveys, use custom employee surveys to track candidate experience and correlate quality with spend.
3. Quality of Hire
Typically measured through a blend of 90-day performance scores, retention rates, and hiring manager satisfaction. Some teams include culture fit or onboarding survey feedback.
- Why it matters: This is a useful metric for evaluating employee performance early in the journey. It links talent acquisition with long-term impact.
- Cadence: Quarterly or bi-annually
- Advanced tip: Add a feedback checkpoint 60 days post-hire to detect early mismatch or disengagement, then trend results by recruiter or source channel.
Engagement & Sentiment
Tracking engagement is no longer just about annual surveys or gut feel. In modern HR, these HR metrics and analytics help you quantify morale, trust, and emotional commitment in real time, across the entire employee experience.
4. Employee Net Promoter Score (eNPS)
Asks employees how likely they are to recommend your company as a place to work, typically scored from -100 to +100. Calculated by subtracting the % of detractors from % of promoters.
- Why it matters: eNPS is a fast proxy for trust, loyalty, and overall sentiment. It also makes engagement trends visible to the C-suite.
- Cadence: Monthly or quarterly
- Helpful context: eNPS works best when viewed alongside other indicators like sentiment trends or participation rates, which together form a more complete engagement index.
5. Pulse Survey Participation Rate
Tracks what percentage of employees respond to weekly or biweekly pulse surveys. It reflects both reach and perceived relevance of your questions.
- Why it matters: Low participation signals fatigue or mistrust. High, steady participation shows employees are engaged in the feedback loop.
- Cadence: Weekly
- How we help: HeartCount tracks participation trends automatically, allowing you to visualise response patterns across teams and spot friction points before they spread.
6. Burnout Risk Score
A composite metric based on indicators like declining mood, late-night activity, low recognition received, and survey fatigue over time.
- Why it matters: Burnout is a leading cause of disengagement and turnover. Tracking it helps HR and managers take action early.
- Cadence: Weekly, trending monthly
- Pro tip: Segment burnout risk by team or role to identify environmental issues, then track progress after intervention.
7. Performance Rating Distribution
Tracks how performance scores are spread across the workforce, often grouped into categories like “Exceeds Expectations,” “Meets,” and “Below.”
- Why it matters: This metric highlights calibration issues, bias, or unclear expectations. Clustering at the top may signal inflated ratings. A balanced curve usually reflects clearer criteria and stronger feedback culture.
- Cadence: Quarterly or aligned with review cycles
- How HeartCount supports this: Our employees overview dashboard allows you to segment by team, role, or tenure to see rating trends over time and flag anomalies.
8. Training Completion & Effectiveness
Tracks not just who finishes a training, but how it impacts on-the-job behaviour or skill development.
- Why it matters: Completion alone doesn’t equal learning. Combine participation data with follow-up surveys, knowledge checks, or peer feedback to gauge real value.
- Cadence: Per program or quarterly
- Useful tip: Pair training metrics with engagement data, teams that rate learning opportunities highly tend to show stronger retention and internal mobility.
9. Internal Mobility Rate
Measures the percentage of employees who move into new roles internally over a set period.
- Why it matters: A high internal mobility rate often signals healthy development pipelines and a culture of growth. Low mobility may suggest blockers, lack of transparency, or missed retention opportunities.
- Cadence: Quarterly
- Helpful context: Internal mobility often reflects how well an organisation supports learning, goal alignment, and lateral growth, areas tied closely to employee growth and development ideas like upskilling paths, manager coaching, and transparent job frameworks.
Retention & Wellbeing
These HR metrics to track give you visibility into where people are thriving, or quietly slipping away. Monitoring turnover, attrition, and absence trends helps HR teams support wellbeing, address root causes, and prevent avoidable loss.
10. Turnover Rate
The percentage of employees who leave your organisation during a specific period. Can be segmented by voluntary vs. involuntary, tenure, role, or department.
- Why it matters: Turnover affects morale, workload, and business continuity. Tracking it helps uncover deeper issues with management, compensation, or culture.
- Cadence: Monthly and quarterly
- Bonus tip: Compare turnover trends across teams and layer in engagement scores for deeper insight.
11. First-Year Attrition
A focused look at turnover among employees who leave within their first 12 months.
- Why it matters: High early attrition often points to misaligned expectations, poor onboarding, or lack of early support.
- Cadence: Rolling 12-month view
- How HeartCount supports this: Recognition is a key early retention lever, use our employee recognition tools to ensure new hires feel valued and seen in their first weeks.
12. Absenteeism Rate
Measures unplanned time off (typically excluding PTO or holidays) as a percentage of available workdays.
- Why it matters: Spikes in absenteeism may reflect burnout, disengagement, or health issues, especially when clustered by team or time period.
- Cadence: Monthly
- Helpful perspective: Unplanned absences often correlate with workload imbalance and under-recognition, which are common early signs of burnout and overworked employees.
Strategic Alignment & Culture
These metrics measure whether work, leadership, and values are pulling in the same direction. They show how well managers translate strategy into day-to-day behaviours and whether culture supports the outcomes the business needs, all of which are core elements of strategic human capital management.
13. Manager Responsiveness to Feedback
Measures how quickly and consistently managers acknowledge and act on employee feedback, for example median days to respond and percentage of items with a recorded follow-up.
- Why it matters: Fast, visible manager follow-up builds trust and prevents small issues from becoming retention risks.
- Cadence: Weekly tracking, reviewed monthly
- How we help: HeartCount captures feedback threads and timestamps actions so you can measure response SLAs and coach managers where patterns show gaps.
14. Recognition Frequency
Tracks how often employees receive positive recognition, either peer-to-peer or manager-to-employee, normalized per headcount or per team.
- Why it matters: Regular recognition correlates with higher engagement and lower turnover. Low recognition frequency in a team is a practical, fixable driver of disengagement.
- Cadence: Weekly summary, trended monthly
- Practical tip: Look at recognition distribution as well as volume to spot teams that are being overlooked.
15. Values Alignment Score
A composite indicator drawn from pulse questions, story-based feedback, and behavioural signals that measures how strongly employees feel their daily work reflects stated company values.
- Why it matters: Values alignment predicts discretionary effort and long-term retention. Teams that score high on alignment tend to sustain culture through change.
- Cadence: Monthly pulses, quarterly deep-dive
- How to use it: Combine values alignment with performance and turnover metrics to see whether cultural strengths map to business impact. HeartCount surfaces these correlations so leaders can prioritise targeted interventions.

How to Build an HR Metrics Dashboard That Drives Action
An HR metrics dashboard should do more than visualise numbers. Its purpose is to help teams make confident, timely decisions. The strongest dashboards focus on clarity and connection between data and action. A good starting point is a structured pulse survey guide that helps teams collect the right insights on a regular cadence.
Selecting Metrics Based on Business Goals
Every metric should have a purpose. Start by mapping HR initiatives to company goals such as improving retention, accelerating onboarding, strengthening leadership, or increasing internal mobility. Then select the measures that clearly reflect progress toward those outcomes.
A focused dashboard keeps leaders informed without overwhelming them. Aim for three to five high‑impact indicators per category so the story remains clear and actionable.
Turning Data into Insights with HeartCount
Collecting data is only the first step. The value comes from translating numbers into meaningful action. HeartCount connects metrics with context by combining pulse feedback, recognition patterns, and manager follow‑up data in one place. This helps HR teams see not only what is happening but also why. The platform highlights areas where engagement dips, workloads rise, or recognition declines so leaders can respond quickly.
Visualising Trends and Surfacing Risks in Real Time
A strong HR metrics and analytics dashboard visualises patterns over time rather than isolated snapshots. Line charts, heatmaps, and sentiment curves help identify where performance or morale is trending up or down.
In HeartCount, these visuals update automatically, turning weekly feedback and survey responses into live trends. This makes it easier to spot emerging risks, compare teams, and share insights with managers who need them most.
How High‑Performing Teams Use HR Metrics to Improve
The best teams don’t just collect HR data. They use it. Metrics become tools to strengthen performance, reinforce culture, and support people when it matters most. When used well, data tells a story leaders can act on.
Diagnosing Burnout Before It Becomes Attrition
Attrition doesn’t come out of nowhere. You can usually see it coming if you look in the right places. A dip in pulse scores, fewer moments of recognition, more unplanned absences, these are warning signs.
HeartCount links these signals to weekly feedback and workload sentiment so HR teams can flag high‑risk teams early. Instead of reacting too late, you can start a conversation when it still makes a difference.
Tracking Team Sentiment Through Change
Big shifts like reorgs or new policies often create uncertainty, and sentiment data shows how people are actually processing that change. You might notice response rates drop, confusion spike in comments, or engagement start to slip. You may even notice a change in the most exceptional workers who generally don’t show signs of struggle, until they start to disengage quietly.
Tying pulse surveys to key phases of a rollout gives you a timeline of how people are feeling. Teams that track this regularly adapt faster and feel more supported through the process.
Coaching Managers with Metrics That Matter
Managers shape day‑to‑day culture more than any program. But most of them are flying blind. Without data, it’s hard to know what kind of experience their team is really having.
That’s where metrics like recognition frequency, feedback responsiveness, and team sentiment trends come in. With HeartCount, managers can track these patterns directly, adjust in real time, and avoid blind spots before they escalate.
UNDERSTAND
Best Practices for Presenting HR Metrics to Stakeholders
Even the best data falls flat if it doesn’t land with the right people in the right way. High‑impact teams know how to tailor their HR performance metrics to suit different audiences, execs, managers, or cross‑functional leads. The key is to present data that prompts action, not confusion.
What to Share with Execs (and What to Skip)
Executives don’t need every data point. They want signals, patterns, and a clear sense of whether people strategies are helping the business move forward. This means leading with high‑level metrics: engagement trends, attrition forecasts, capacity risk, or cultural alignment.
Skip the operational detail unless it connects to something critical. Instead, use visuals and summaries that show movement over time. Our approach to presenting employee engagement survey results offers a good model: tight narrative, clear priorities, and just enough depth to drive decisions.
Creating a Listen → Diagnose → Act Loop
Metrics alone aren’t enough. You need a rhythm that connects data to dialogue and action. This is where a Listen → Diagnose → Act loop becomes essential.
- Listen: Use weekly pulses, recognition stats, or feedback ratios to capture live data
- Diagnose: Spot shifts, gaps, or risks that need unpacking
- Act: Share insights, follow up, and adjust course where needed
Embedding Metrics into Daily Manager Rituals
The best managers aren’t data analysts, but they do want to understand how their team is doing. When metrics are embedded into their regular routines: standups, check‑ins, 1:1s, they’re far more likely to take action.
HeartCount makes this easier by feeding relevant HR KPIs into manager dashboards so they can see patterns in recognition, sentiment, and feedback at a glance. It turns data into habits, not just reports.

FAQs About HR Metrics
What Makes a “Good” HR Metric?
A strong HR metric connects directly to a business priority, is easy to understand, and leads to action. It should be consistently defined, regularly tracked, and capable of showing meaningful trends across time, teams, or initiatives.
How Often Should You Track These Metrics?
The cadence depends on the metric. Engagement and feedback-related metrics are best tracked weekly. Others like turnover, absenteeism, or training effectiveness are typically reviewed monthly or quarterly to give enough time for patterns to emerge.
What Tools Help Automate HR Reporting?
Tools like HeartCount automate tracking and visualisation of HR KPIs through real-time dashboards, weekly pulse surveys, and manager feedback loops. This reduces manual reporting and helps HR focus on insight.
Can HR Metrics Predict Culture Problems?
Yes. When tracked consistently, HR metrics can highlight early signs of deeper cultural issues, such as low participation, rising burnout, or manager unresponsiveness, before they result in disengagement or attrition.