What’s new at HeartCount: Semiannual report

This month, we’re introducing a major upgrade to the Semiannual Report, one of the most valuable features in the HeartCount platform.
The report breaks down all the statistics and scores for every employee experience category you have been surveying for six months. Plus, it gives you an in-depth look at each question sent to your employees during this period.
It will help you understand the degree to which your employees feel satisfied, fulfilled, engaged, and happy at work and how these sentiments might affect overall turnover and attrition.
Let’s jump right in!

-
1.Report summary
-
2.Well-being and response rate
-
3.Employee engagement metrics in semiannual report
-
4.Employee Net Promoter Score (eNPS)
-
5.Intent to leave
-
6.Dimensions of employee engagement
-
7.Employee engagement categories
-
8.Employee metrics
-
9.Engagement categories
-
10.Team metrics
-
11.Results over time
-
12.Conclusion


This month, we’re introducing a major upgrade to the Semiannual Report, one of the most valuable features in the HeartCount platform.
The report breaks down all the statistics and scores for every employee experience category you have been surveying for six months. Plus, it gives you an in-depth look at each question sent to your employees during this period.
It will help you understand the degree to which your employees feel satisfied, fulfilled, engaged, and happy at work and how these sentiments might affect overall turnover and attrition.
Let’s jump right in!
Report summary
HeartCount’s Semiannual report is generated twice a year. It’s based on the data gathered from (bi)weekly automated pulse check surveys. The report is available on July 15th and January 15th in the report section on the left side of the dashboard.
- In July, you can find data about the state of your workforce from January to June.
- In January, you can find data about the state of your workforce from July to December.
As each question in the pulse check survey is linked to one of the eight categories of employee engagement, the report includes data on:
- Well-being
- Personal advancement
- Job satisfaction
- Attitude towards the company
- Relationship with management
- Relationship with colleagues
- Productivity and efficiency
- Feedback and recognition.
As an admin, you can compare team results with the company’s overall performance. If you are a manager, you can see how each team separate team you manage compares with others.
You can select the desired team from the dropdown menu. To navigate through the report easily, use the ‘Jump to Section’ option to go directly to your chosen section effortlessly. All report data can be exported as a PDF.
To see all data about metrics, engagement categories, and dimensions, select the Semiannual report from the menu at the top.

Well-being and response rate
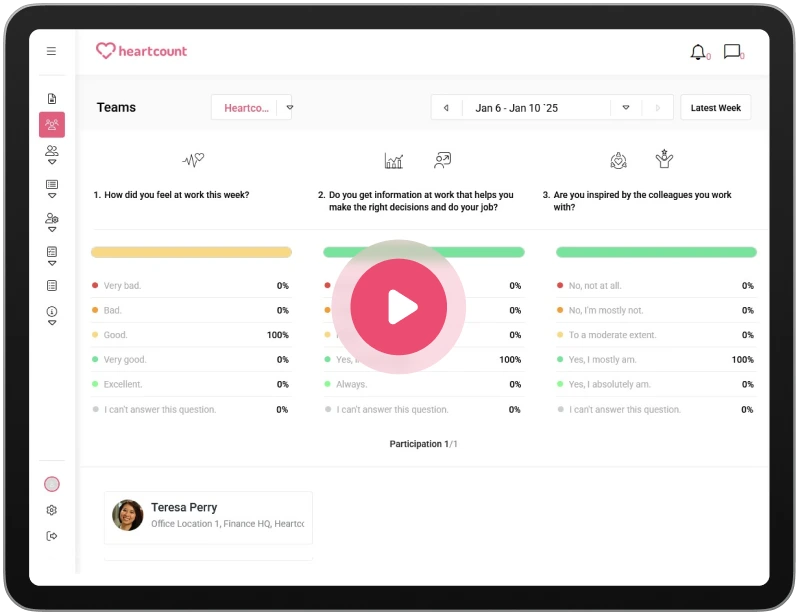
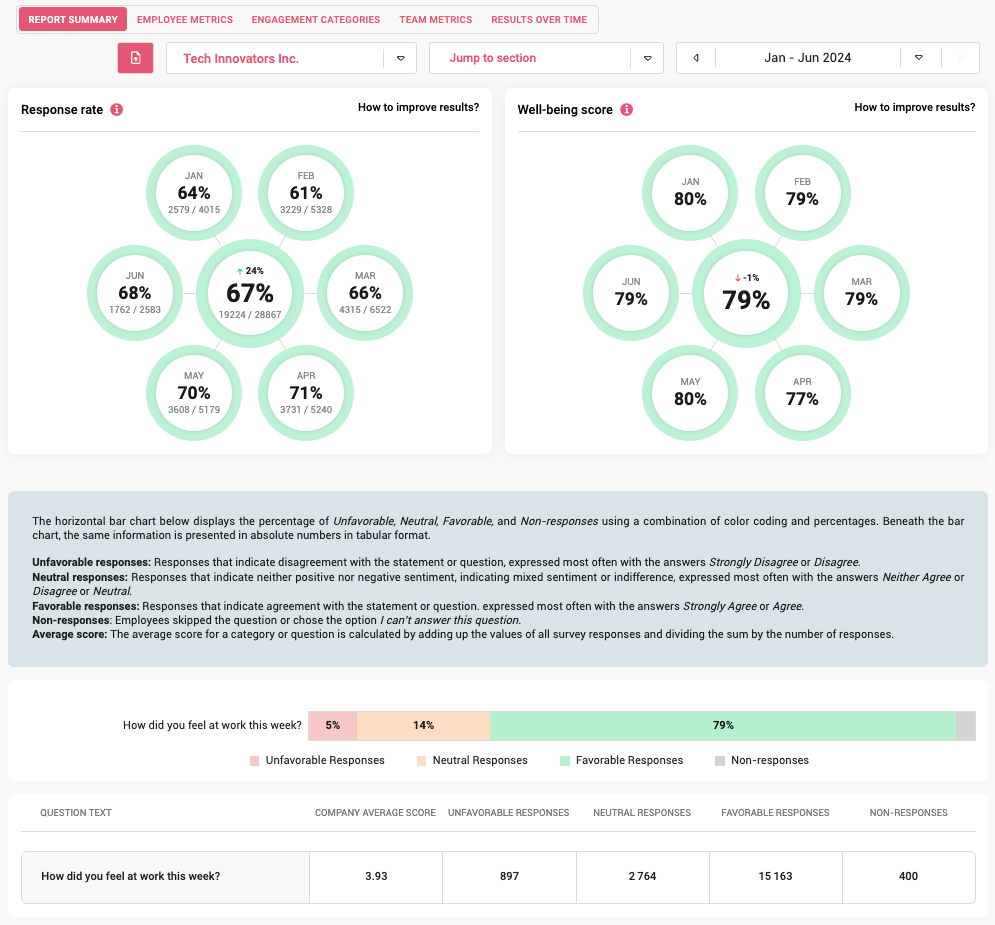
In the report, you can see the chart that presents how much time employees felt good at work in the last six months compared to the previous period. Excellent results are colored green, satisfactory results are colored orange, and unsatisfactory results are colored red.
It’s crucial that employees share their opinions often to gather more relevant feedback and gain real-time insights into employee satisfaction. However, employees don’t always want to participate in providing feedback.
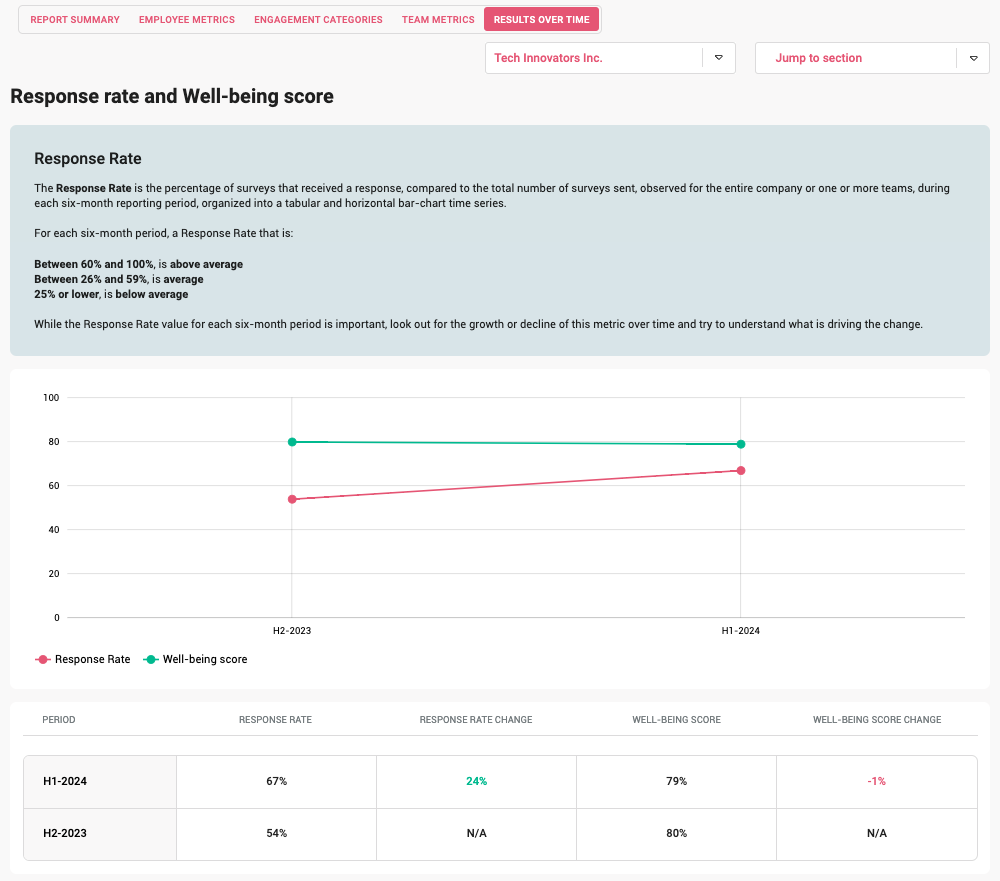
To provide relevant data, our Semiannual Report presents the Response Rate, which is the percentage of surveys that received a response compared to the total number of surveys sent during the reporting period.
On the left side of the chart below, you can see how the response rate has changed compared to the previous report. So, the response rate is 69%, which is 23% higher than the previous six months.
On the right side of the chart below, for example, employee well-being for the past six months is 79%, which is 1% lower than the previous six months.
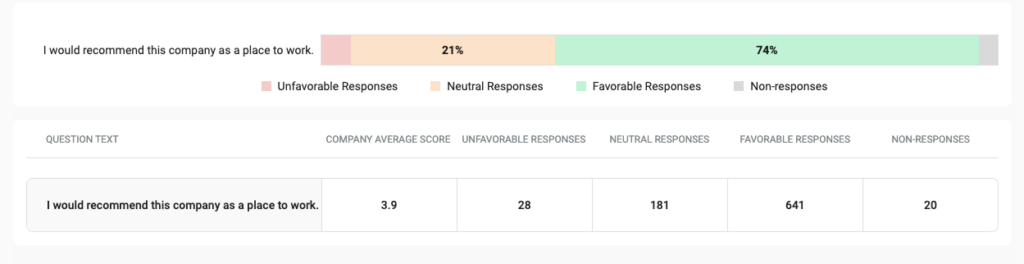
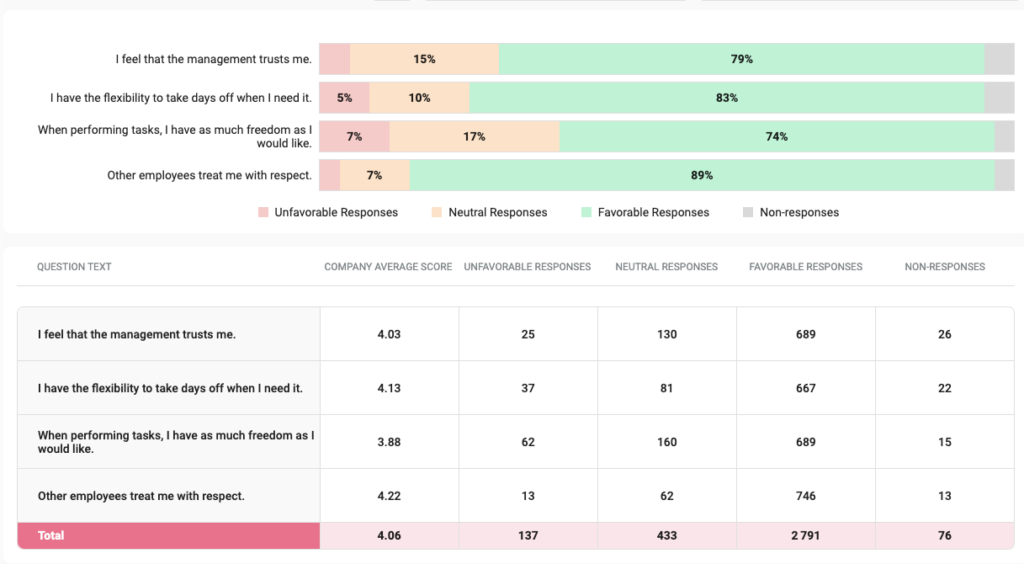
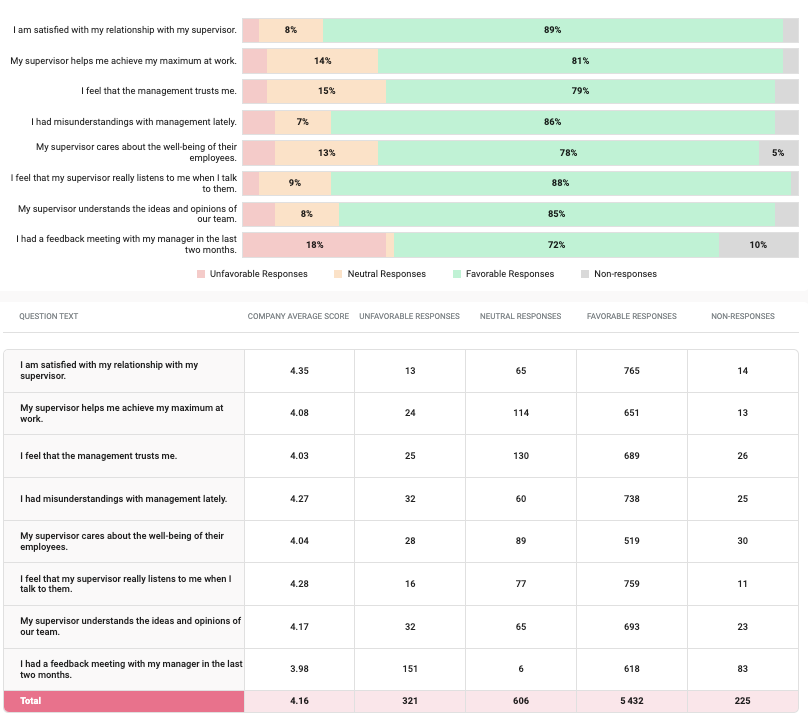
You can also see the percentage of unfavorable, neutral, favorable, and non-responses per question indicated through color coding and percentages.
In the example below, 5% of employees disagreed with the question, 14% indicated mixed sentiment or indifference, and 79% expressed feeling good at work.
The same information is presented in absolute numbers in tabular format.
What does this information help you understand on an organizational level?
Employee well-being is a crucial category that impacts employee engagement and satisfaction.
If your employees experience burnout or struggle with mental issues, they won’t be engaged and productive. Employees who feel supported in their roles tend to be more committed.
By systematically tracking and understanding the well-being of your workforce, you can pinpoint areas for improvement and prioritize initiatives to improve overall employee well-being and job satisfaction.
Good practice for improvement
If you find out that your employees’ well-being score is low, here are some practices you can implement to improve your organizational culture:
- Implement an employee well-being program
- Encourage feedback within all departments and focus on answering every feedback transparently
- Recognize and appreciate every employee and actions that move the needle
- Promote work-life balance and optimize project management within low-scored departments
- Create a supportive workplace environment
- Prioritize professional growth through internal and external programs
The report also dives deep into several advanced metrics, including:
COLLECT
Employee engagement metrics in semiannual report
Employee Engagement Index (EEI)
You can now have a precise overview of the Employee Engagement Index, the number of employees who met the EEI criteria, and the EEI participation rate.
This gives you clear signals about whether the organization is experiencing positive or negative trends regarding employee growth and engagement.
A company becomes eligible for EEI calculation after receiving at least 14 surveys containing EE questions.
The index calculation includes only responses from employees who answered at least 60% of the questions from the engagement group during this period.
The report provides an overview of these company or team-level metrics. You can also select a team and compare its results with the overall company results.
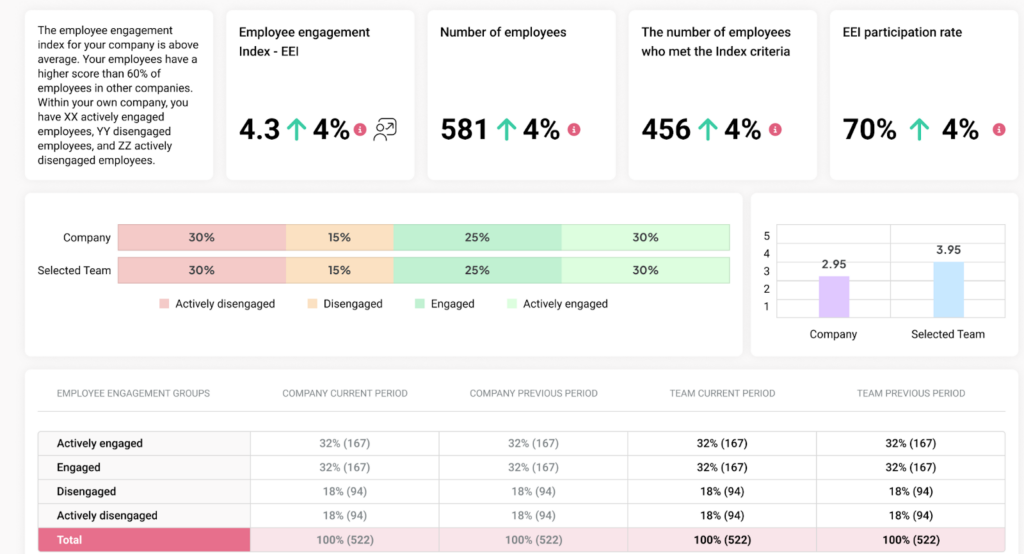
Moreover, you now have a preview of each separate question, which helps you better understand the results and identify the specific issues related to job satisfaction and engagement.
What does this information help you understand on an organizational level?
Data about your EEI can help you understand how employee engagement affects key performance indicators, such as retention, productivity, customer satisfaction, or profitability.
Benchmarking this data against industry standards lets you pinpoint specific issues and make more informed strategic decisions.
Good practice for improvement of employee engagement
If your employee engagement index is low, you need to reconsider and redefine your employee engagement strategy.
By systematically improving each employee engagement category we discussed earlier, you can create a more motivated and productive workplace, ultimately increasing EEI.

Employee Net Promoter Score (eNPS)
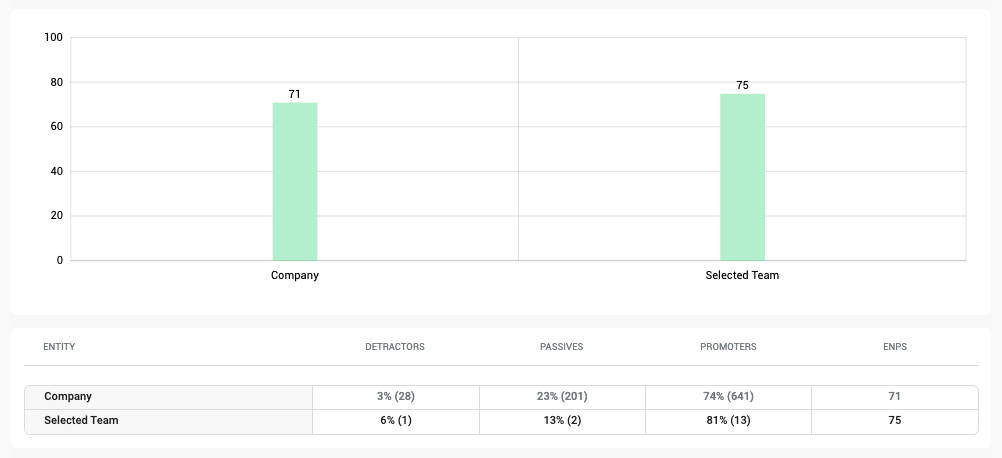
In the Semiannual report, you can see how likely employees are to recommend the company to others. The report precisely shows the number of promoters, passives, and detractors based on their responses over the past six months.
The Employee Net Promoter Score (eNPS) ranges from -100 to 100, and the charts display exactly your organization’s and your team’s score. In the report, you can see the percentage and absolute numbers of detractors, passives, and promoters in the company overall. Also, you can compare the team eNPS score with the company results.
Understanding exactly how loyal your employees are and why they are loyal can greatly improve employee efficiency and the cost-effectiveness of your workforce.
What does this information help you understand on an organizational level?
Data about eNPS helps you identify critical employees before they decide to leave. The insights gained from this report enable you to identify detractors within your company and convert them into promoters to prevent employee turnover.
Good practice for improvement of eNPS
When you receive concise information on detractors, you can conduct stay interviews to determine the cause of their dissatisfaction. At the same time, one-to-one meetings should be held with promoters or long-term loyal employees to identify what matters most to them.
Based on that information, your HR team can develop loyalty programs and organize training sessions with employees to address different areas such as:
- Career development
- Diversity, equity, and inclusion
- Mental health and well-being
- Work-life balance
- Effective workplace communication
- Constructive feedback
- Changes in the workplace
Intent to leave
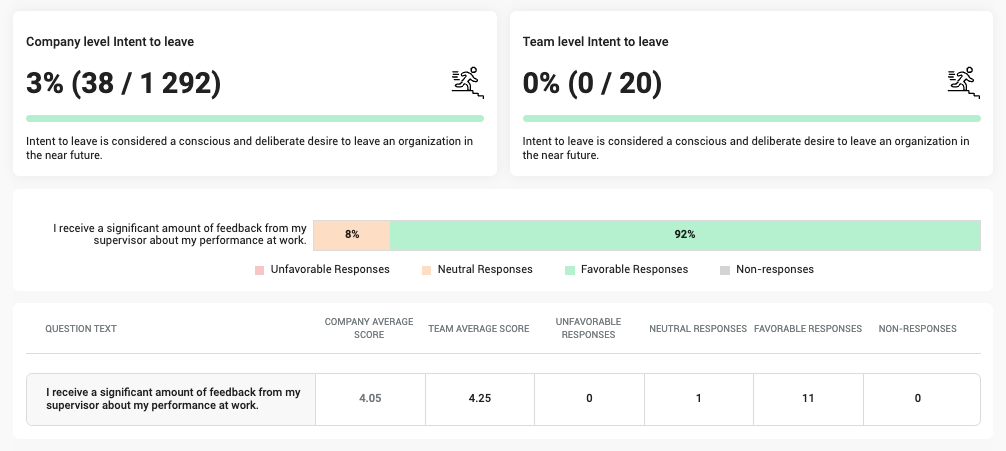
This report helps you precisely identify employees who are likely to leave the company soon.
It details both the percentage of the employees intending to leave at the company level and absolute numbers.
For example, as shown in the photo below, 3% of employees, or 38 out of 1,291 employees, are thinking about leaving. You can compare the team’s intent to leave with the company’s results.
What does this information help you understand on an organizational level?
A high intent to leave indicates employee dissatisfaction, suggesting they may be actively seeking other opportunities.
By regularly tracking intent to leave, you can identify critical employees and work with them to mitigate factors leading to their potential departure.
This approach helps retain valuable talent and strengthens overall employee satisfaction and engagement by promptly addressing underlying issues.
Good practice for improvement
To reduce your employee’s intent to leave, you must discover factors contributing to their dissatisfaction with the company.
In 2024, the most common reasons employee leave their job include:
- Limited career opportunities
- Inadequate compensation and benefits
- Burnout, overworked, or overstressed
- Toxic work environment
- Poor leadership
- Lack of work-life balance
However, to understand why your employees leave, implement employee pulse checks, conduct stay and exit interviews, hold one-on-one meetings, and analyze employee engagement categories regularly.
UNDERSTAND
Dimensions of employee engagement
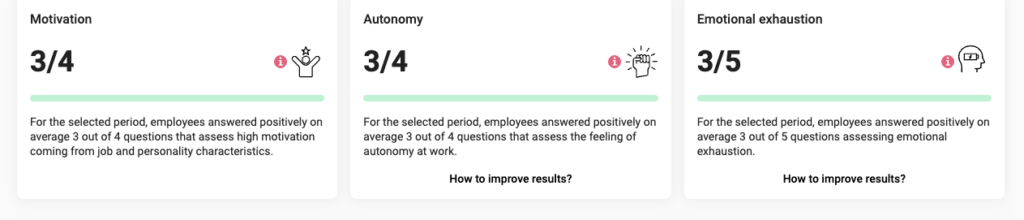
The report presents results on three dimensions of employee engagement measured over a six-month period – Motivation, Autonomy, and Emotional Exhaustion.
Motivation
Excessively high or low scores on the questions below can help you identify potentially risky individuals and highly motivated employees in your company.
What does this information help you understand on an organizational level?
Motivation is a fundamental component of employee engagement. Both intrinsic and extrinsic motivators play crucial roles in driving engagement, impacting overall performance, productivity, and retention.
By understanding the factors that motivate employees, you can create an engaged, committed, and high-performing workforce.
The report’s data allows you to see the average motivation score for your company, team, or employee.
Good practice for the improvement of motivation
If you find that the motivation levels of your employees are low, try the following:
- Set clear expectations and goals
- Recognize and reward great performers
- Give employees autonomy
- Encourage teamwork
- Offer employee benefits and perks
Autonomy
With the autonomy metrics in the report, you can see whether your employees feel they have a choice and control over their work.
You’ll be able to spot both positive and negative responses and identify the most critical areas.
What does this information help you understand on an organizational level?
Lack of autonomy can lead to reduced engagement, as employees may feel their contributions are less significant and that there is a lack of trust and freedom at work.
Data from this report can help managers understand employees’ perceptions of autonomy. Based on that, managers can develop strategies to encourage employees to take more initiative and autonomy in their roles.
Good practice for improvement of autonomy
If you observe a significantly low number of positive answers in your report, consider taking the following steps to increase the autonomy of your employees at work:
- Empower employee participation and decision-making by providing enough context for better decision-making
- Provide a flexible work environment
- Allow employees to manage their own workload
- Recognize and reward initiative and autonomous work
Emotional exhaustion
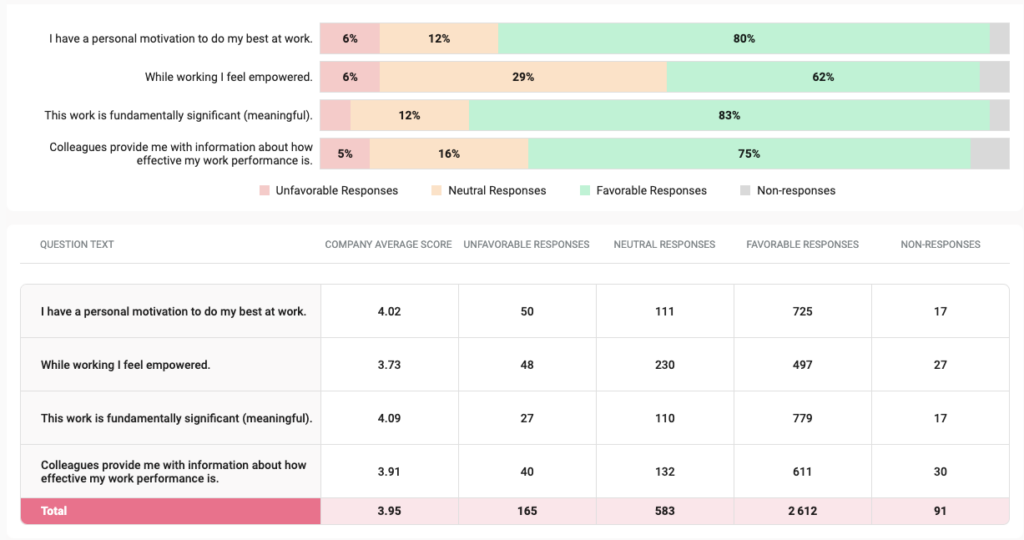
We also added emotional exhaustion metrics to the semiannual report, which were followed during the past six months.
This helps you understand if your employees feel emotionally exhausted due to excessive stress at work and feel that they lack control over their workload and the resources to perform their jobs successfully. The chart below shows the percentage and absolute numbers per question.
What does this information help you understand on an organizational level?
Emotional exhaustion can often go unnoticed, especially when an employee’s challenges at work are not recognized.
Data in this report can help you identify employees who may be experiencing chronic fatigue and recognize signs of it before it affects their motivation or productivity.
Good practice for the improvement of emotional exhaustion
If you recognize emotional exhaustion symptoms, taking immediate action is crucial. You can:
- Promote work-life balance
- Adjust or reduce workload
- Clarify roles and responsibilities
- Encourage regular breaks and time off

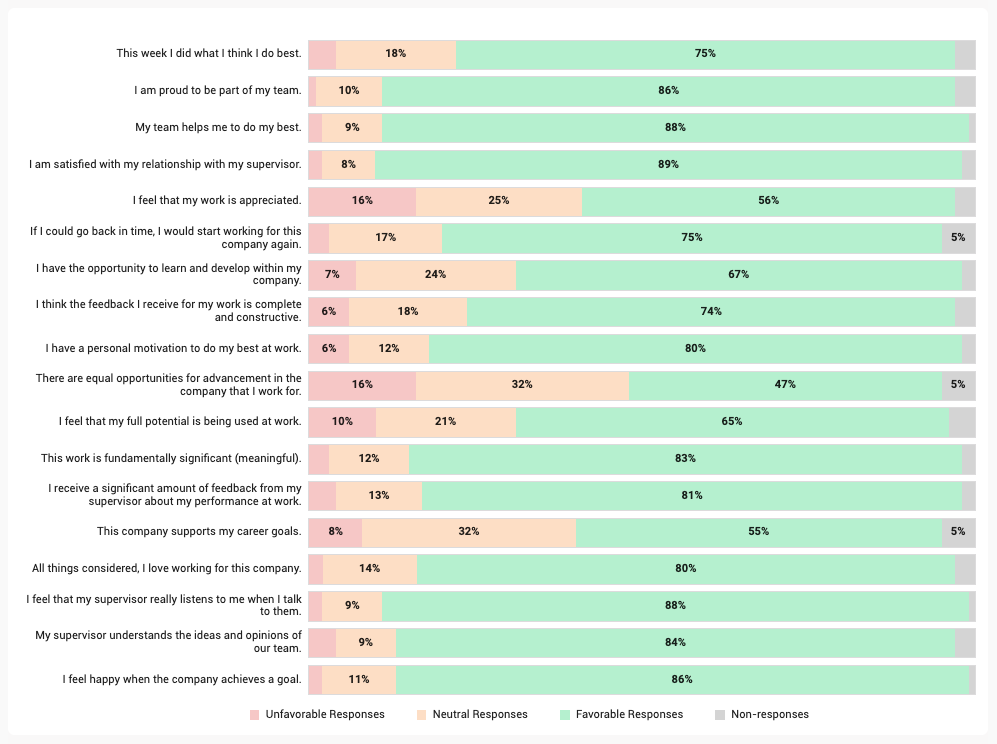
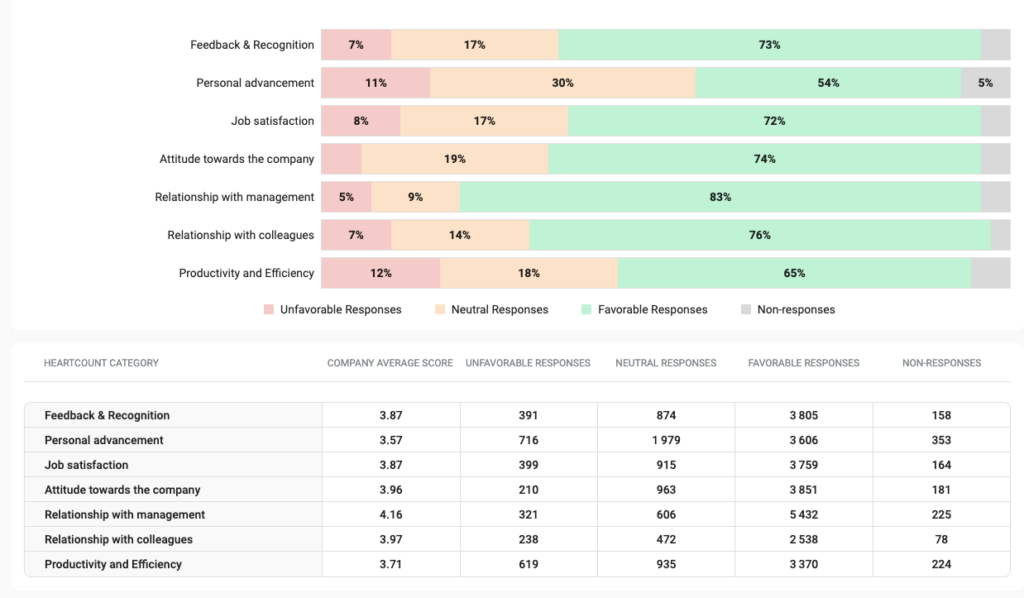
Employee engagement categories
The Semiannual report contains the scores and metrics associated with each Employee engagement category.
This should help you recognize your organization’s leading areas for improvement.
What does this information help you understand on an organizational level?
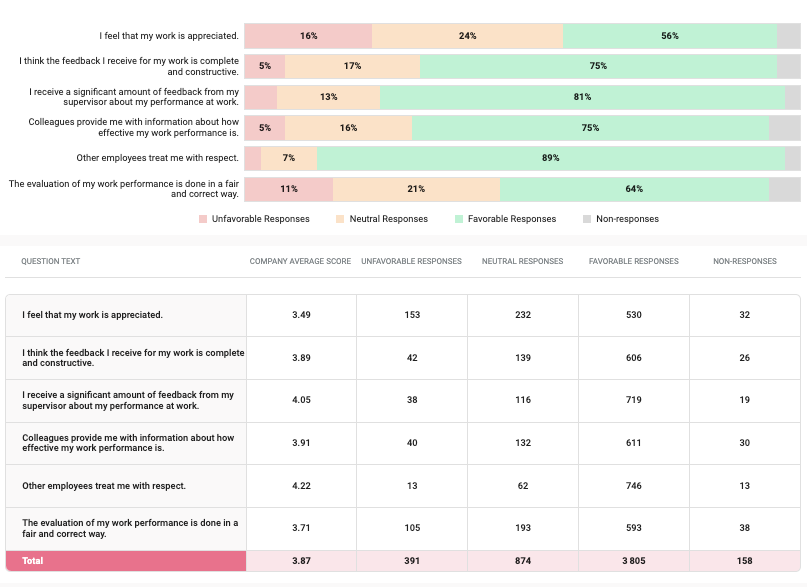
Feedback and recognition
The feedback & recognition reflect employees’ opinions and feelings about the feedback and recognition they receive for their performance and contribution at work.
This report includes data on regular performance reviews, praise, awards, and other forms of appreciation and feedback.
Understanding how employees perceive feedback and recognition enables managers to improve retention strategies and promptly address any dissatisfaction.
Good practice for improvement
Improving employee engagement is crucial, especially because engaged employees tend to be 17% more productive than their peers.
Here are a few suggestions for making things better:
- Provide work-life balance
- Encourage a culture of support and collaboration
- Encourage managers to set clear expectations
- Create a feedback loop where employees can see the outcomes of their input
- Implement recognition and reward systems
- Offer training programs, workshops, and seminars that cater to the career interests of your employees.
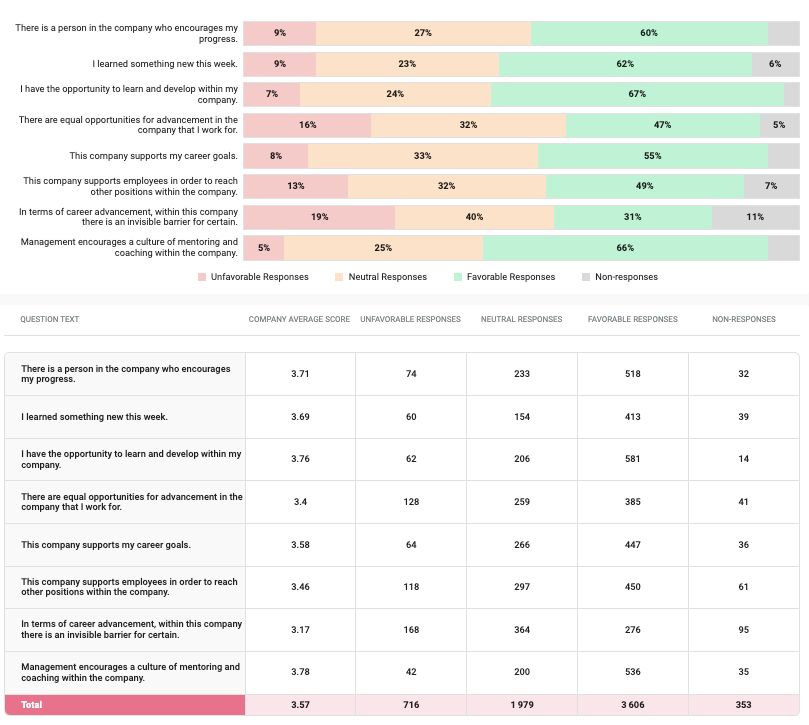
Personal advancement
86% of employees would change their jobs for better growth opportunities. Tracking your employees’ personal advancement helps you align their career aspirations with the direction your company is heading.
With data from this report, you will have a clear strategy for investing in your employees’ development, which can save costs, increase job satisfaction and performance, and reduce employee turnover in the long run.
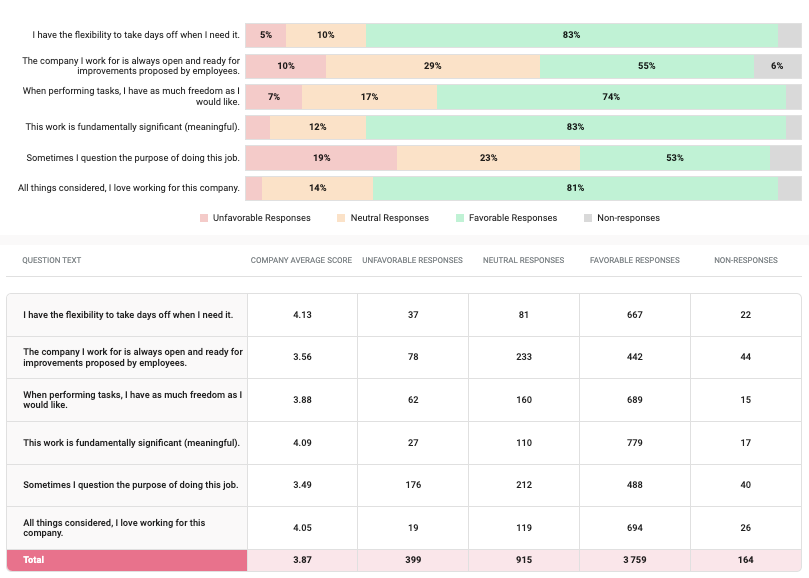
Job satisfaction
Job satisfaction measures how fulfilled employees are with their jobs. It covers aspects such as work environment, compensation, work conditions, and job alignment with their skills and interests.
Data from this report is crucial for managers as it provides insights into employee retention likelihood.
Understanding job satisfaction levels helps managers pinpoint areas where employees may be dissatisfied and take proactive measures to prevent turnover.
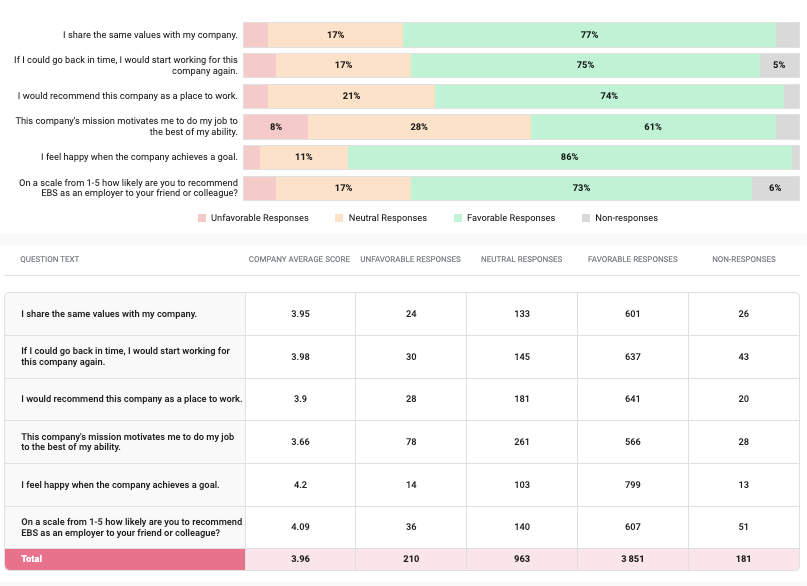
Attitude towards the company
The attitude towards the company reflects how employees feel and perceive the organization as a whole.
This includes their loyalty, commitment, pride in being part of the company, and alignment with its values and mission.
Negative attitudes lead to distrust, resentment, and resistance among employees, ultimately impacting business outcomes.
Keeping track of employee attitudes toward the company helps you create a positive workplace and address potential negative feelings early on.
Relationship with management
The relationship with management reflects the quality of interactions and trust between employees and their supervisors or managers.
Data from this report helps management understand how their employees perceive managerial support, leadership effectiveness, communication, and the ability to provide guidance and direction.
These factors directly impact employee productivity, satisfaction, and overall organizational culture.
Organizations that nurture positive relationships with employees have higher business success and sustainability.
Relationship with colleagues
The relationship with colleagues category reflects the quality of employee interactions and collaboration.
Data from this report helps management understand aspects such as teamwork, communication, mutual respect, and the overall social environment in the workplace.
Monitoring team dynamics allows you to manage conflicts and resolve issues before negatively impacting productivity or morale.
Productivity and efficiency
Productivity & efficiency reflect employees’ thoughts and feelings about how effectively they perform their tasks and contribute to organizational goals.
Data from this report helps managers understand employees’ opinions and sentiments about output, quality of work, time management, and the efficient use of resources.
When managers understand how employees perceive their own productivity and efficiency, they can implement necessary changes to streamline processes and improve performance.
For example, they can organize tailored training and allocate resources to ensure alignment between company objectives and employees’ goals.
Select Semiannual metrics in the menu at the top to separate metrics and view results for each team and employee.

ACT
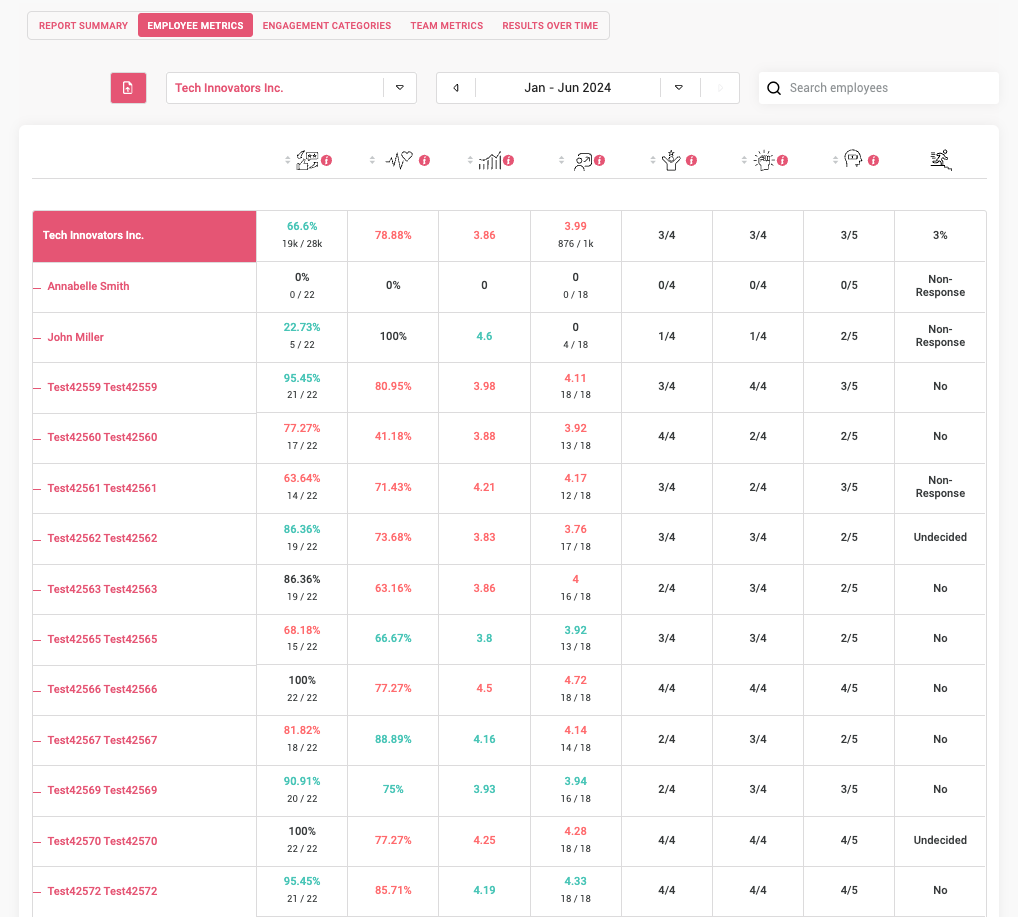
Employee metrics
Use semiannual metrics to gain insights into response rate, well-being score, happiness score, EEI, intent to leave, motivation, autonomy, and emotional exhaustion:
- For each team and individual employee within the team
- During the periods of January to July or July to December
All data is color-coded for easy interpretation. As shown below, black indicates no change from the previous semiannual report, green results signal improvement, yellow represents a minor warning change, and red highlights a significant negative change.
Select Semiannual categories in the menu at the top to see all data about employee engagement categories per employee and team.


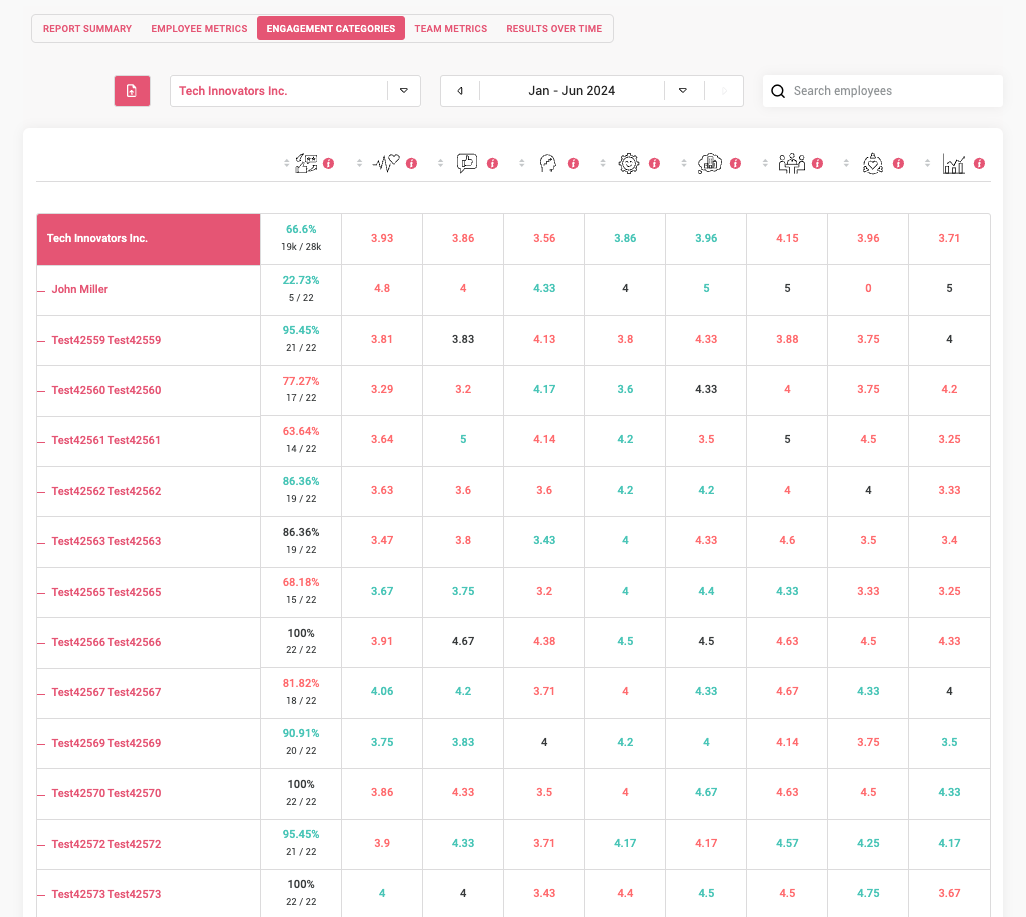
Engagement categories
Next, you can view all employee engagement categories together in a tabular format for easy comparison and analysis. You can select:
- Specific employee and team
- Periods of January to July or July to December
To separate metrics per each team within the company, select Semiannual team metrics in the menu at the top.

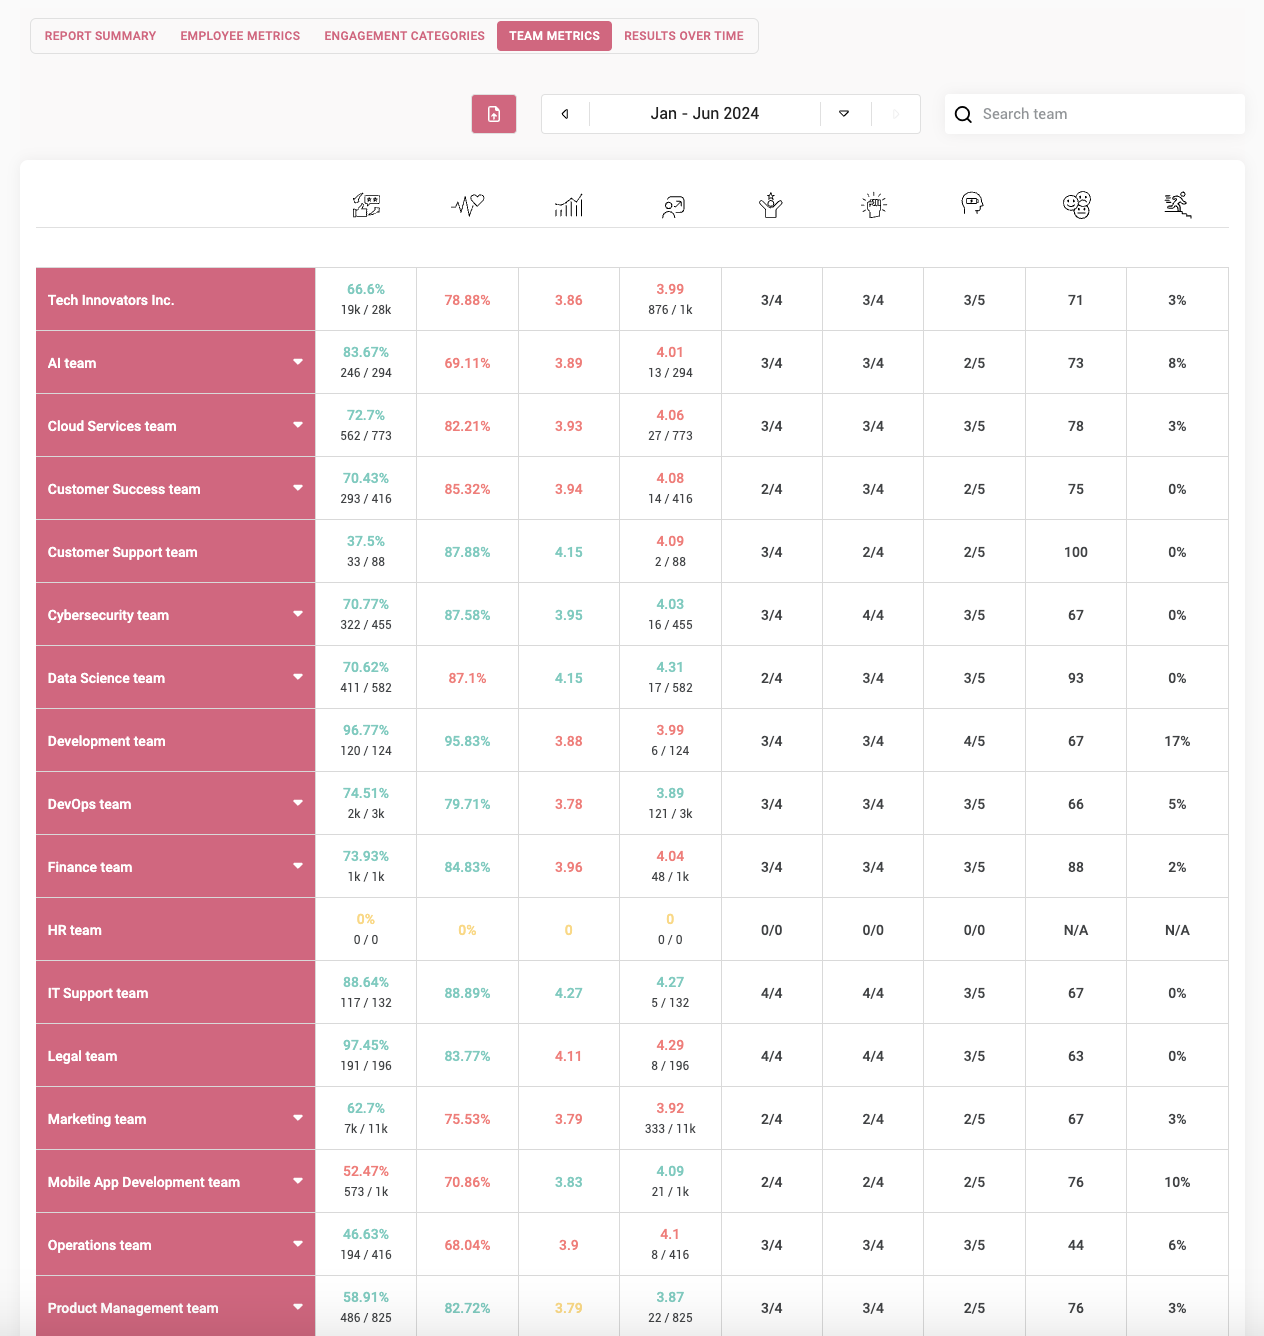
Team metrics
The semiannual team metrics show the response rate, EEI, well-being score, happiness score, motivation, autonomy, emotional exhaustion, eNPS, and intent to leave for every team over the selected period of time.
You can effortlessly compare teams within the company and discover where the biggest issues are. This information can be used to address problems and discuss improvements with team leaders.
To compare your data historically with the previous Semiannual reports, select Results over time in the menu at the top.

Results over time
When analyzing each six-month report individually, the scores and metrics related to each employee engagement category will promptly capture your workforce’s sentiment and behavioural pattern.
With the results over time in the Semiannual report, you can track and compare your results with those of the previous reports.
This helps you identify the growth and decline in employee experience metrics and dimensions over time.
Also, you can understand the driving factors behind these trends and make informed decisions for long-term strategic planning.
COLLECT
Conclusion
That’s all for now! We are actively working on developing new features to better meet all your needs.
Be sure to check out our product tour to find out more about HeartCount!