The Complete Guide to Employee Net Promoter Score (eNPS)


-
1.What is the employee net promoter score - eNPS?
-
2.Benefits of measuring eNPS
-
3.Drawbacks of eNPS
-
4.How to measure employee net promoter score?
-
5.What is a good employee net promoter score?
-
6.Employee net promoter score benchmarks by industry 2024
-
7.Practical tips for improving eNPS score
-
8.Conclusion


Attracting top talent is one of employers’ biggest challenges in 2024, as 77% report difficulty finding the talent they need.
Today’s job market is very different from ten years ago. Employee engagement, satisfaction, and loyalty are hugely important today. These are often the “tipping scale” for candidates when someone recommends an organization as a good workplace.
How can you know if your talent is engaged and satisfied? More importantly, if they would recommend their organization to others?
By measuring the employee net promoter score (eNPS).

What is the employee net promoter score – eNPS?
An employee net promoter score (eNPS) helps employers measure employee engagement, satisfaction, and loyalty.
The eNPS is based on the Net Promoter Score (NPS), created by Bain & Company, Satmetrix Systems, and Fred Reichheld. This score measures the percentage of customers who would promote your business.
One of the most significant benefits of the eNPS lies in its simplicity.
It’s just one question:
On a scale of zero to ten, how likely would you recommend our organization as a place of work to others?
You can also ask something like:
From 0 to 10 (0 being “very unlikely,” 10 “very likely”), would you recommend our company as an excellent workplace to your friends and family?
The eNPS is a scale from 0 to 10, where 0 is “not at all likely to recommend an organization,” and ten is “very likely to recommend.”
Based on their response, the eNPS scale places talent in three categories:
- Detractors
Those who scored 0 to 6 on the eNPS scale are called “Detractors.”
Detractors are people who are more likely to criticize an organization than recommend it. They are usually employees with low levels of satisfaction and loyalty. They could risk the company by spreading negative attitudes about it within or outside it.
Addressing these can help you significantly reduce your turnover rate.
- Passives
Passives are those that scored 7 or 8 on the scale. They are, for the most part, neutral about the company and would neither recommend it nor criticize it to others.
- Promoters
Finally, the promoters are employees who scored 9 or 10 on this scale. They are enthusiastic about the company and are most likely to spread positive word of mouth about the organization.
The promoters are your business’s advocates, representing your most engaged, satisfied, and loyal employees.
Benefits of measuring eNPS
We have already pointed to its simplicity as the main benefit of the employee net promoter score, but it’s not the only one.
What are the benefits of eNPS?
- It is easy to use as employees don’t need too much time or effort to complete it. For most, it doesn’t take more than a minute. Similarly, conducting research is not a massive problem for HR as it’s just one question, and the formula is straightforward.
- Very high participation rates. Usually, the employee net promoter score has a 100% participation rate. Very rarely will people refuse to participate in the eNPS survey, and even if they do, there’s always an option to allow them to fill it in anonymously.
- It’s repeatable. eNPS is not a one-and-done metric, but it can be used repeatedly, allowing for ongoing employee engagement monitoring. While there’s no hard rule on how frequently you should conduct eNPS surveys, we recommend doing them at least once yearly. This will help you identify and understand long-term employee satisfaction and engagement trends.
- It’s genuine. Finally, eNPS provides genuine employee feedback, and, as an employer, you can take employee sentiments represented in eNPS with a reasonable degree of certainty.
Drawbacks of eNPS
Naturally, the employee net promoter score isn’t perfect and has some limitations.
The most notable eNPS drawbacks include:
- Lack of context. The eNPS consists of just one question, so it doesn’t honestly tell you what to focus on. This just tells you if you have more people who think positively or negatively about your company, not why. To understand this, you’ll have to dig deeper.
- They are ignoring Passives. The eNPS scale has three components: promoters, passives, and detractors. Yet only two, promoters and detractors, go into it. What about passives or “neutrals?” These employees often represent a significant section of your workforce that can quickly shift to one or the other side.
- Wide Detractor range. The detractor range goes from 0 to 6. That’s a pretty extensive range compared to passives (7 to 8) and promoters (9 to 10). Someone who responded with a 0 to the eNPS survey is probably likelier to talk negatively about the company than someone with a 6.
- It doesn’t say “why”. The eNPS score shows how likely (or unlikely) employees are to recommend an organization as a place to work. It doesn’t say why they recommend it. It could be because of the excellent employee experience and engagement, but it could also be for a good paycheck, benefits, or relationship with colleagues, etc.

How to measure employee net promoter score?
Employee net promoter score calculation
The formula for employee net promoter score calculation is straightforward:
eNPS = % of Promoters – % of Detractors
Or,
((Number of Promoters – Number of Detractors) / Total Number of Responses) x 100
Both formulas will give the same result, so it’s up to you which one you’ll use.
Note that the eNPS score does not include passives but only promoters and detractors. That doesn’t mean you should ignore neutral ones, as they can easily lean. Instead, make an effort to improve their engagement.
Examples of employee net promoter score
Let’s say there are 100 employees in a company. Of those:
- Sixty employees scored 9 to 10. These are promoters
- Twenty employees scored 7 to 8. They are passives
- Twenty employees scored 0 to 6. That’s detractors.
Since we are ignoring passives or neutrals, our eNPS score will be:
60 (% of Promoters) – 20 (% of Detractors) = 40.
Or, using the other formula for calculating eNPS:
((60 promoters – 20 detractors) / 100 responses) x 100 = 40.
What is a good employee net promoter score?
The eNPS score can range from -100, where all employees scored between zero and six (Detractors), to 100, where all employees scored nine or ten (promoters).
- -100 to 0. This means there are more detractors than promoters, and you may need more ideas to boost your employee engagement and satisfaction
- 10 to 30 is considered a “good eNPS score.”
- 30 to 70 is a “great eNPS score.”
- 70 to 100 is an “excellent eNPS score.”
Of course, this is a generalization, and interpreting your eNPS score will largely depend on your industry.
Employee net promoter score benchmarks by industry 2024
According to research by Hive, the average eNPS for the first quarter of 2024, across all sectors, was 7, representing a +2 increase compared to Q4 2023.
If we look at the industries and their eNPS score individually, it looks like this:
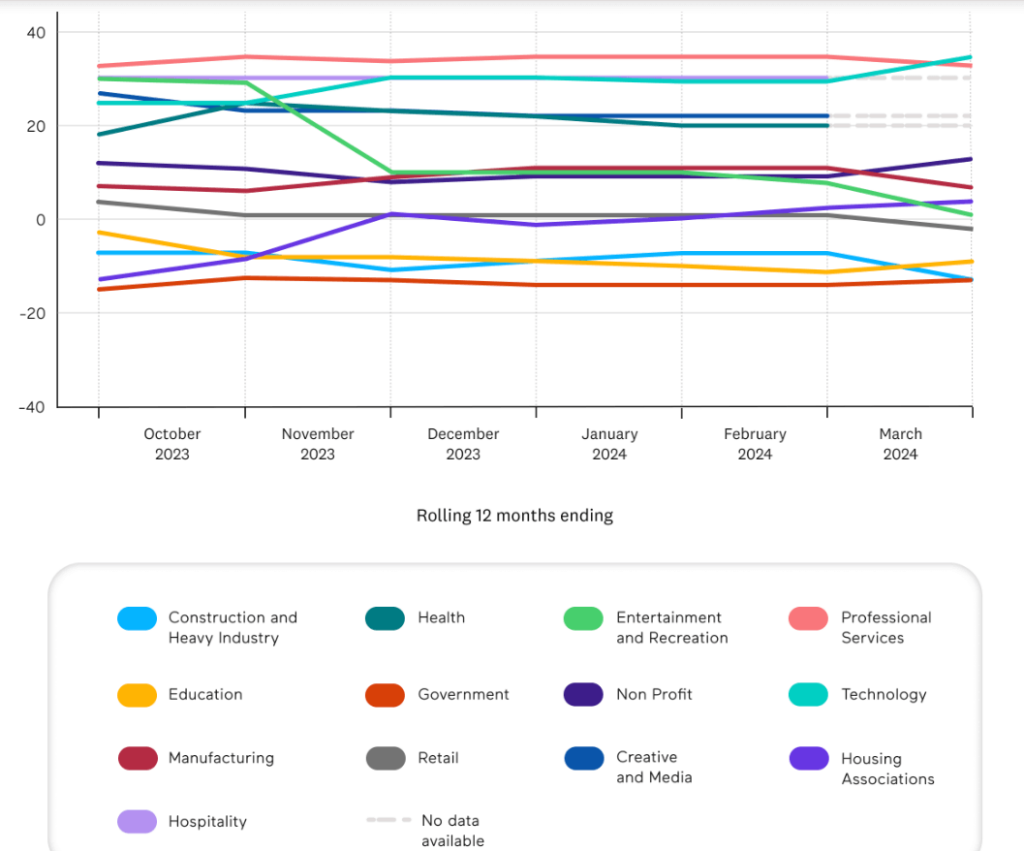
Source: https://www.hive.hr/the-employee-engagement-benchmarks-q1-2024/
Or:
| Industry | eNPS Score |
| Construction and heavy industry (light blue) | -5 |
| Health (dark green) | 22 |
| Entertainment and recreation (light green) | -5 |
| Professional services (pink) | 35 |
| Government (orange) | -12 |
| Education (yellow) | -10 |
| Non-profit (dark purple) | 0 |
| Tech (teal) | 25 |
| Manufacturing (maroon) | -20 |
| Retail (gray) | -5 |
| Hospitality (red) | -30 |
| Creative & Media (dark blue) | 10 |
| Housing associations (purple) | 0 |
According to another survey by Perceptyx, which included over 15 million employees in global organizations across different industries, the employee net promoter score benchmarks for 2021 and 2022 were 13.8 and 14.9.
Here’s how this looks per industry:
| Industry | eNPS score |
| Information | 28 |
| Professional services | 23 |
| Finance and insurance | 22 |
| Health care | 17 |
| Admin and support | 8 |
| Manufacturing | 9 |
| Retail | -1 |

Practical tips for improving eNPS score
The employee net promoter score represents your employee value proposition. The good news is that it’s not set in stone, and you can improve it with a little effort.
Here are five ways to increase your eNPS score:
- Respond to feedback
That means “all” employee feedback, not just negative or positive. Acknowledge their participation and communicate how you intend to build on the positive and address the negative feedback.
- Engage with detractors
Keep an open mind about criticism. Your unhappy employees likely have a reason they feel this way about your organization, and ignoring them will just make things worse. Instead, look for ways to connect with them and act on their feedback.
- Celebrate your employees
A Promoter won’t always stay one if you ignore them. Ensure employees see and feel you value them by recognizing their achievements and celebrating milestones. Encourage employees to continue to be awesome.
- Offer growth and development opportunities.
Providing training and development that promotes growth leads to better employee productivity and satisfaction. Today, of those who quit their job, 30% cite the lack of development opportunities as the main reason. Nobody wants to work a dead-end job.
- Track your progress
“Complacency is the enemy of progress,” as Dave Stutman said. This is true for your employee net promoter score as well. Employee loyalty and satisfaction can easily change, and while your eNPS score is good today, it doesn’t mean it will stay that way tomorrow.
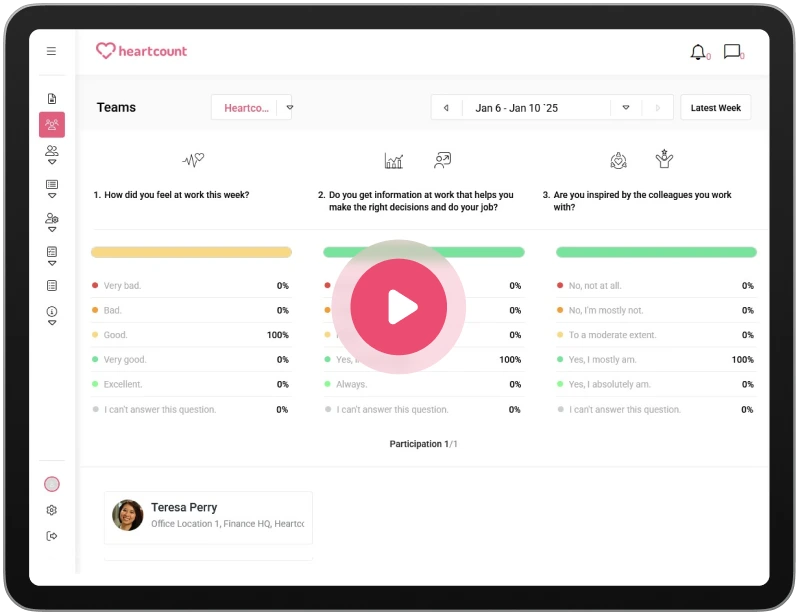
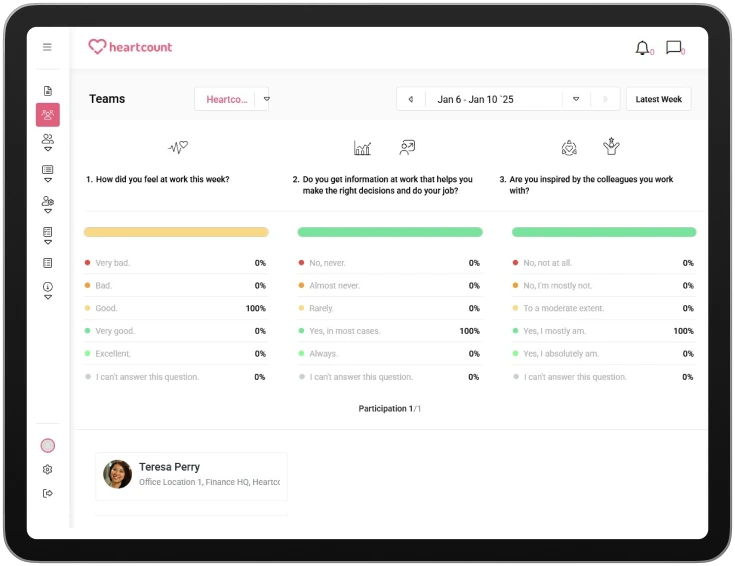
With HeartCount, you can measure employee Net Promoter Score through regular pulse surveys or by creating custom surveys.
Weekly Pulse Surveys consist of three simple questions covering eight categories of employee engagement and well-being. Every six months, one of the questions in the regular survey measures Net Promoter Score.
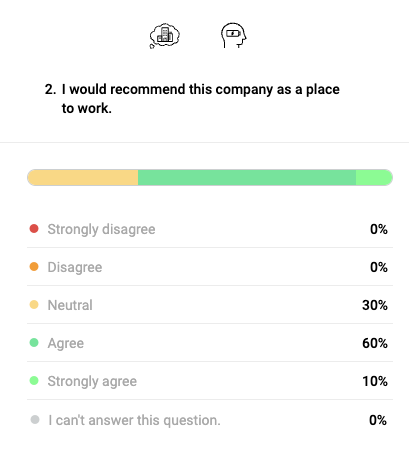
Employees are asked a simple question: “Would you recommend our company to a friend or colleague as a good place to work?”
If you choose to create custom surveys, you can design your own questionnaire with between 1 to 50 questions to measure eNPS.
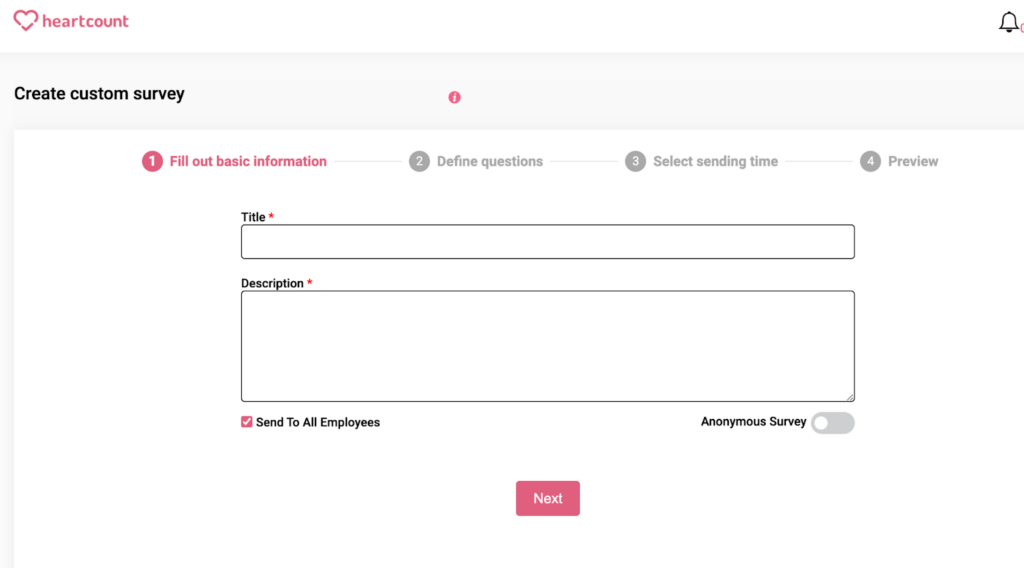
Once your surveys are sent, you can easily view, analyze, and interpret responses through intuitive dashboards.
Conclusion
The employee net promoter score is a fantastic metric for measuring your employees’ sentiment about your organization, but it’s usually not enough to measure their happiness.
Take a step further and try HeartCount for free for 14 days.